Ok, Here are the answers finally!
I received new answers still after the intended answer time was out so I wanted to see if someone is still doing those and did not start putting answers online. But Now! Let’s go through the first 8 questions today.
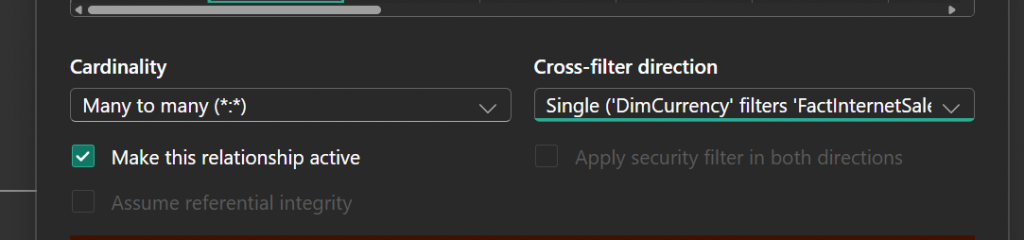
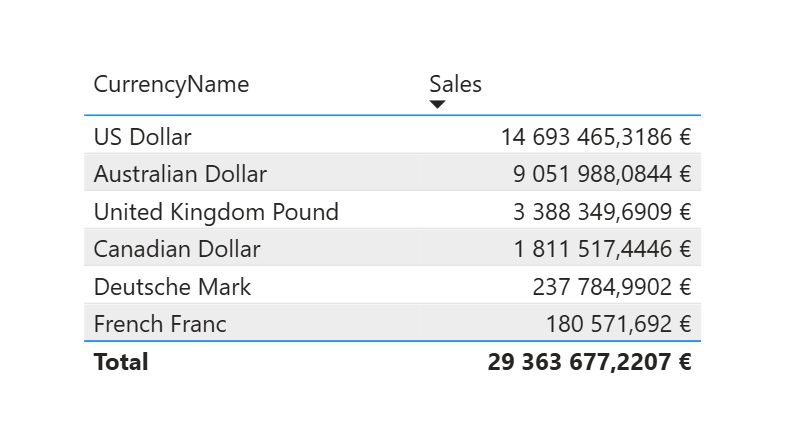
Day 1 – Power BI Sales Report
Answer to this is behind relationships. relationship between Currencies and fact is not working. It has to be activated and turned around.
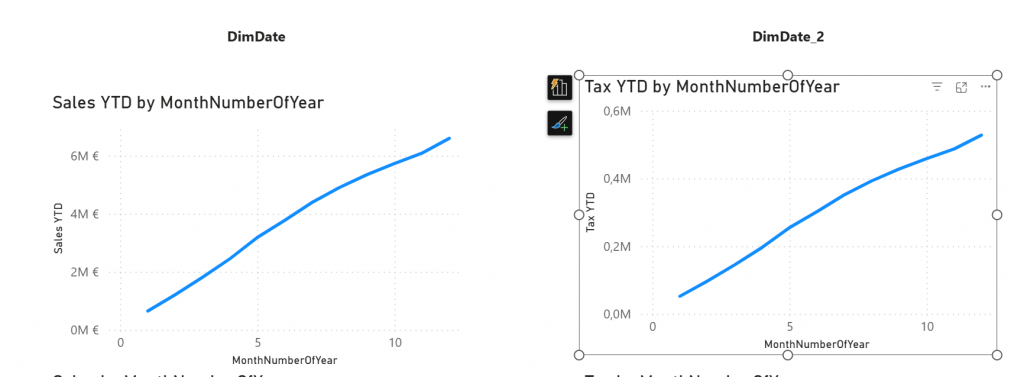
Day 2 – Power BI YTD Sales and Tax report
Day 2 answer is to mark table as date table.
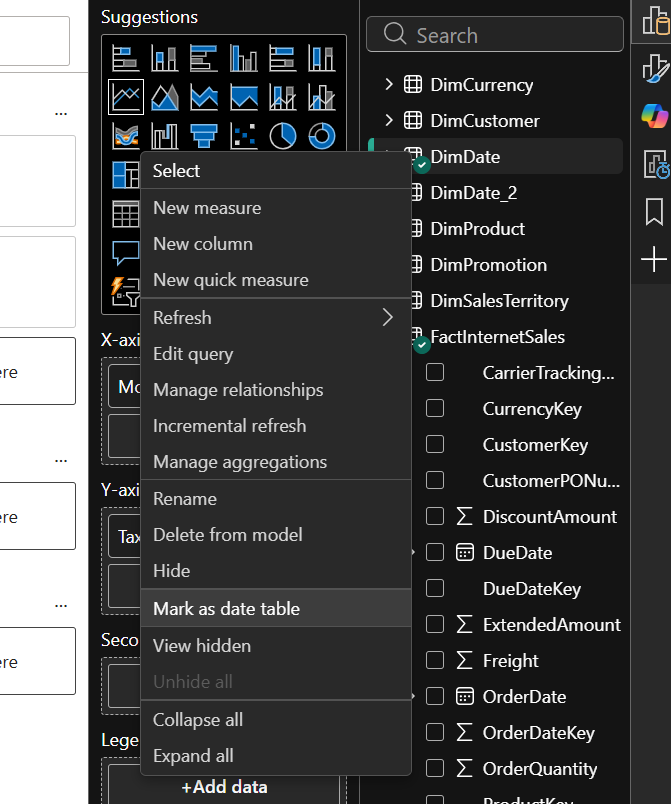
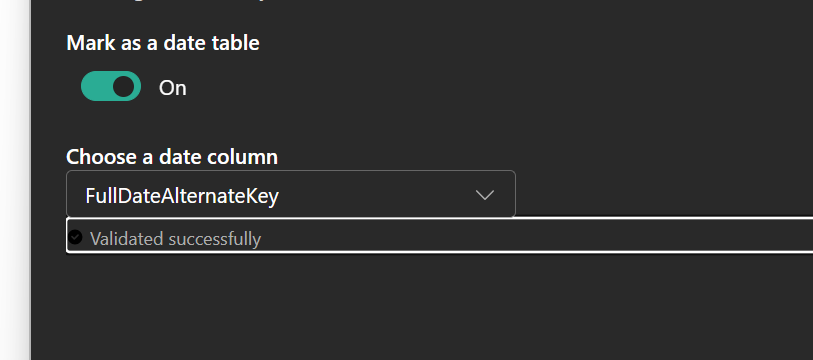
After that visuals look ok
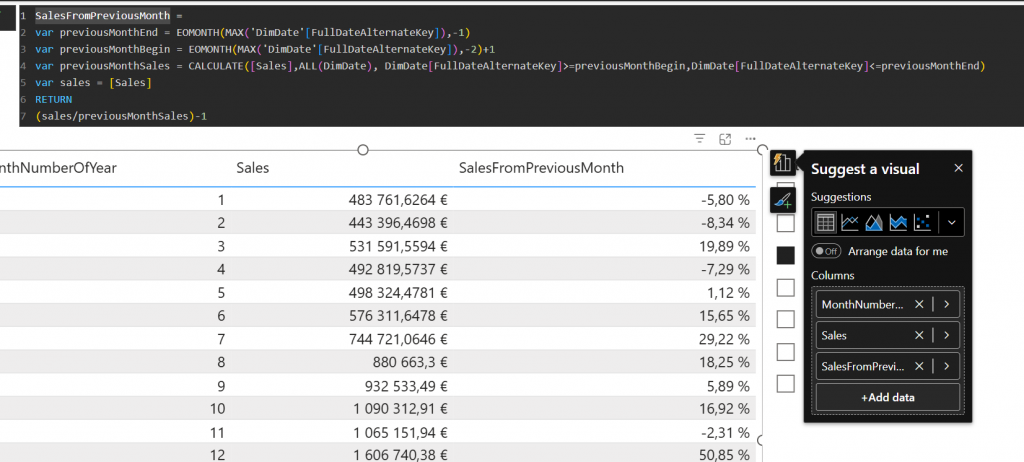
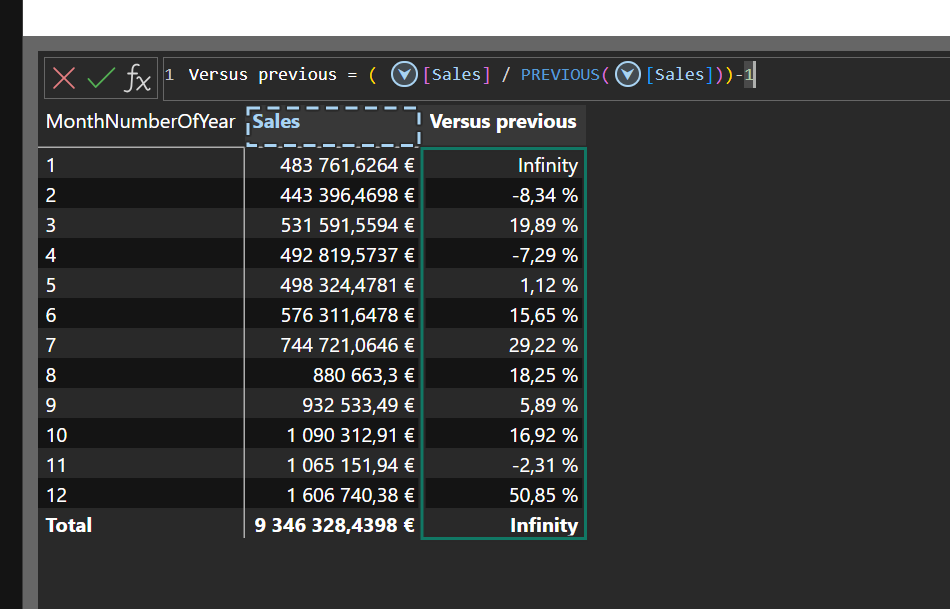
Day 3 – Sales Growth comparing previous month
Day 3 was about creating a measure. Measure took growth percentage from previous month. Here is an example how you could do that.
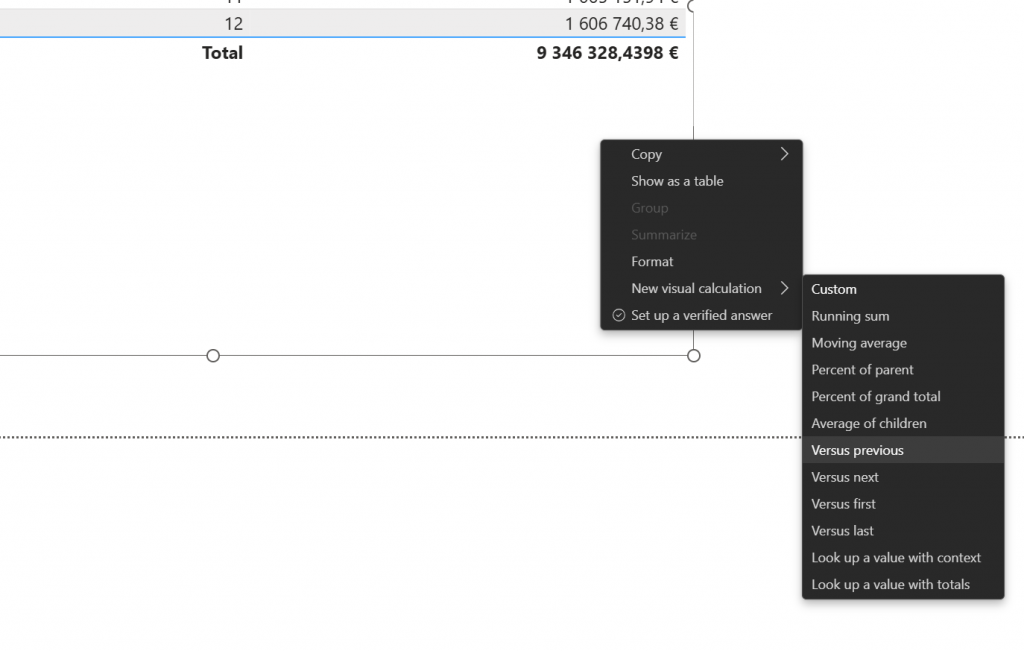
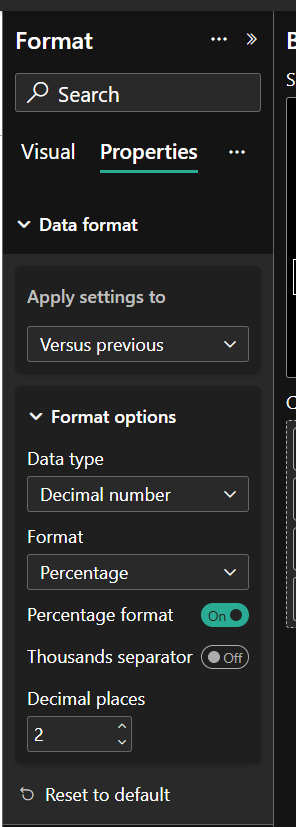
Day 4 – Sales Growth comparing previous month using visual calc
Answer to challenge was to create visual calc. With visual calc we were comparing to previous value and then formatting that as percentage.
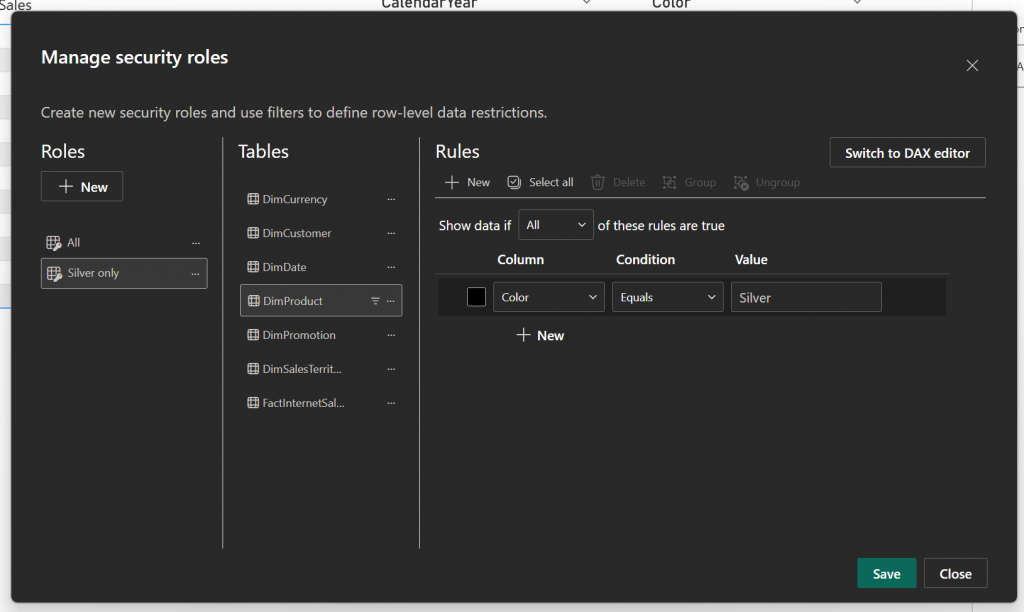
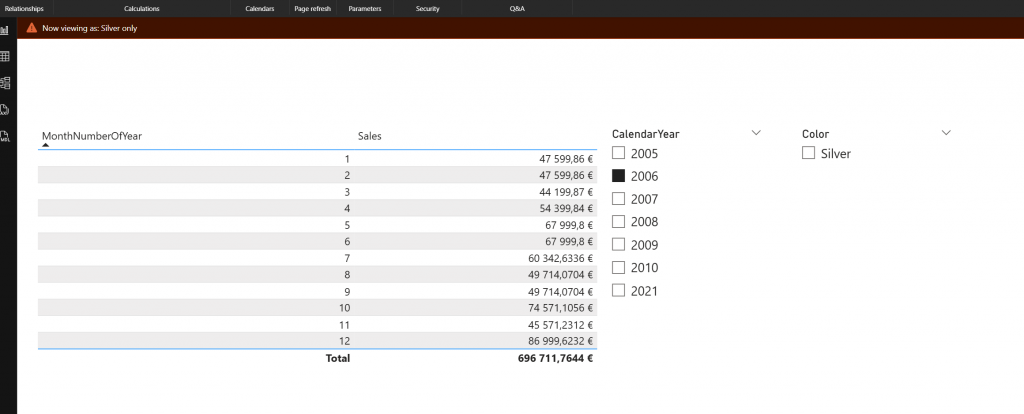
Day 5 – Roles to protect data
Day 5 challenge was about security roles. This was quite easy as this type of role can be created with user interface purely.
Day 6 – Web data and map visuals
This was a independence day celebration. There was no actual correct answer. It was just about “test map visuals”.
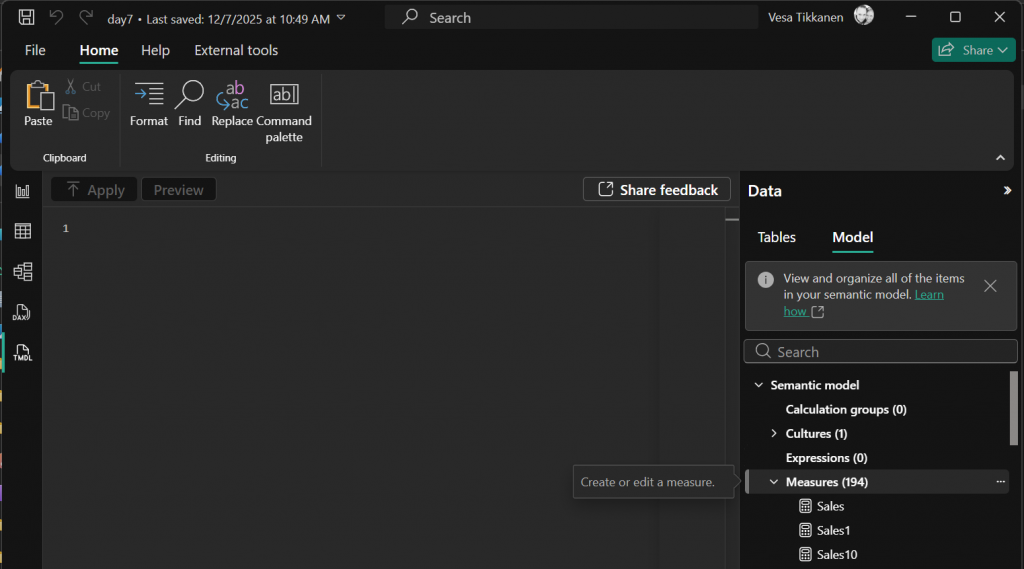
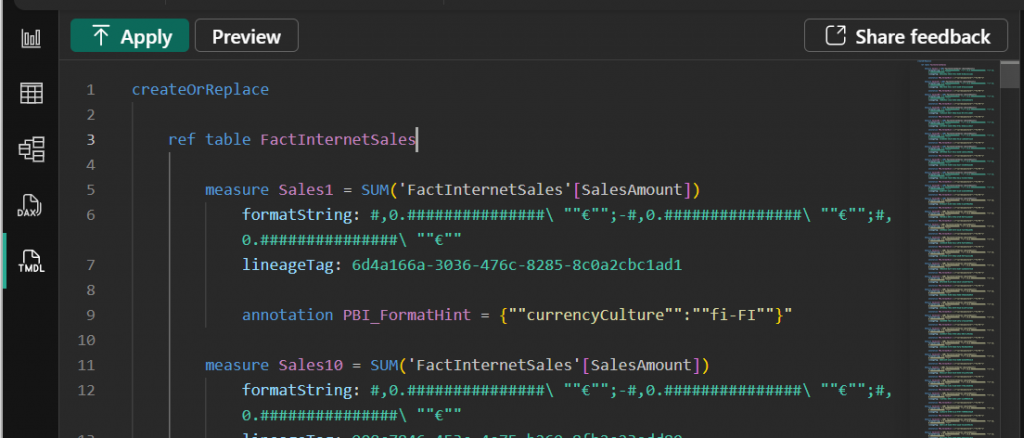
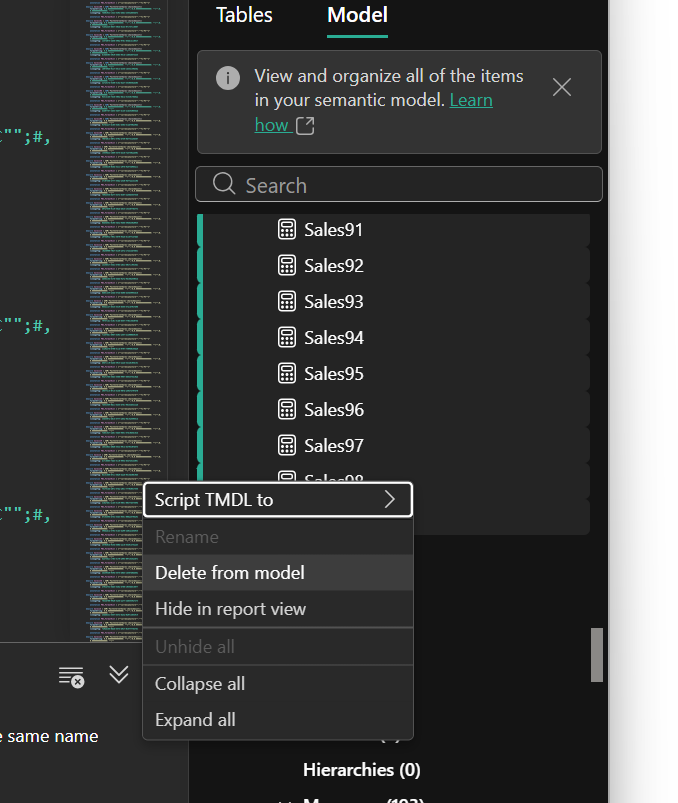
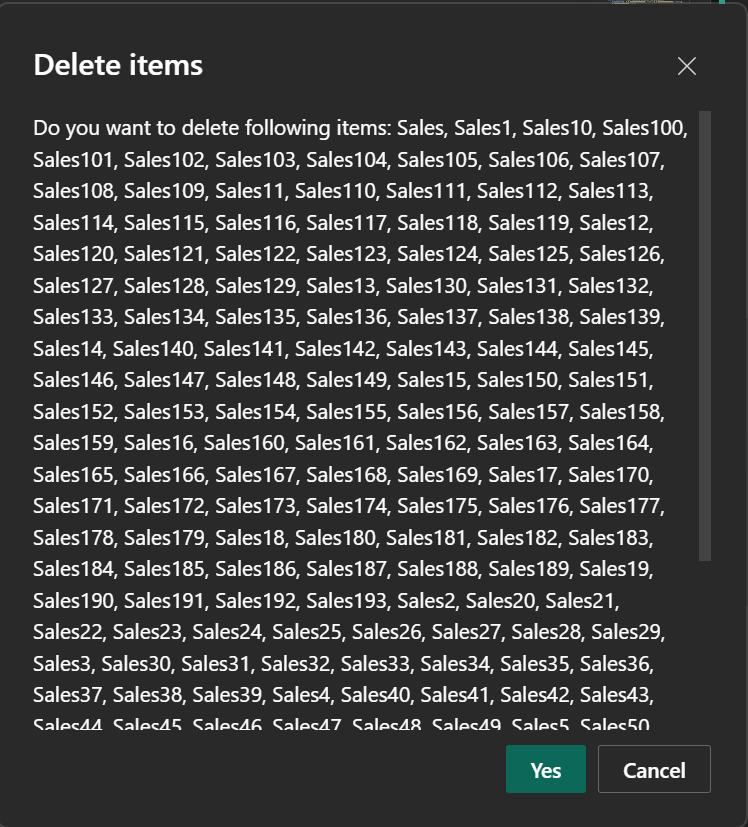
Day 7 – batch change within the model
Day 7 challenge was about batch moving objects in semantic model. This can quite easily be done with tmdl view.
Within TMDL view you may script all the measures to window. Delete all measures from the model and recreate them after that.
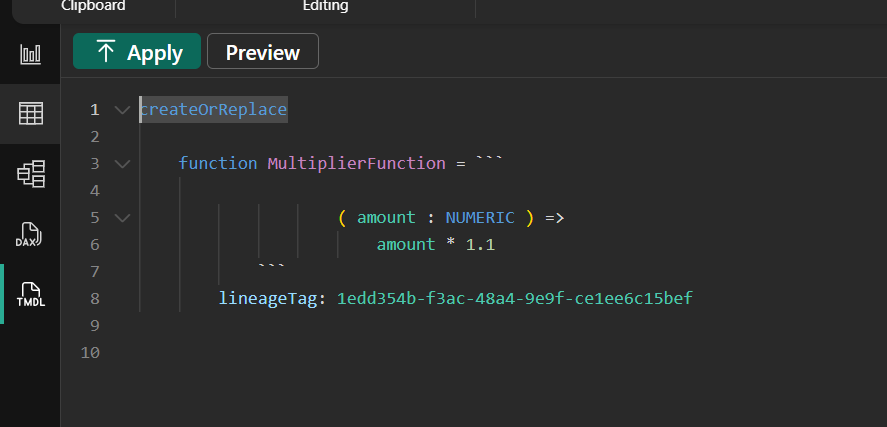
Day 8 – Reusable code in DAX Model
Challenge was about DAX User Defined Functions. With UDF you can create reusable code that can be called across multiple measures.
Example udf: