Christmas Challenge 2025 – Day  17 – Moving average

Power BI is celebrating its 10th anniversary! To mark this milestone, I invite you to participate in the Power BI Christmas and holiday season Calendar. This special event features 24 unique challenges, each designed for you to solve and enjoy throughout the season.

A new challenge will be released every day, starting December 1st and continuing through December 24th. Each day presents a fresh opportunity to test your Power BI skills and creativity.

At the conclusion of the event, a winner will be selected from among the participants. Microsoft Finland has generously offered a prize, with further details to be provided soon.

Throughout December, we will maintain and announce a leaderboard, showcasing participants’ progress. Correct answers will also be shared. You will have two days to solve each puzzle; for example, the puzzle released on day one will close at the end of day two.

Day 17 Challenge

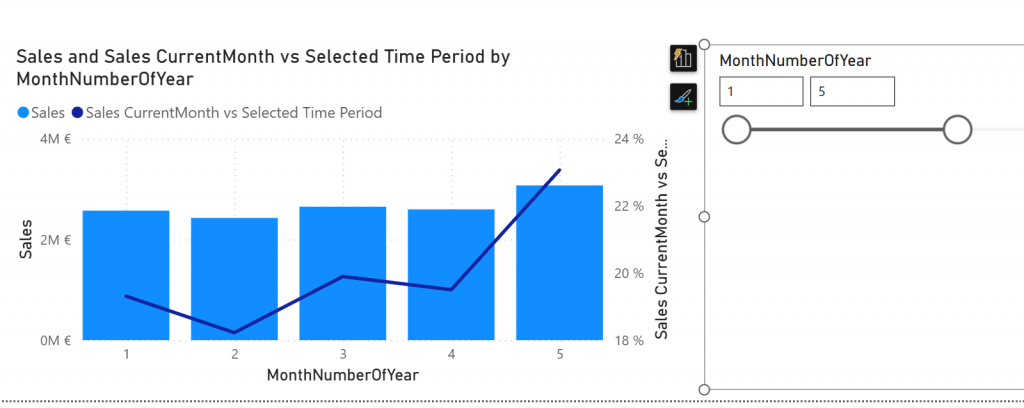
Today it is about moving average. Your task is to calculate moving average of 3 months for any given date. If longer period than date is shown it will be 3 months before the end-of-period. I mean that if month’s are shown as columns, moving average is 3 months average up-to-end-of-shown month. If years would be shown the 3month average would be oct-nov-dec.

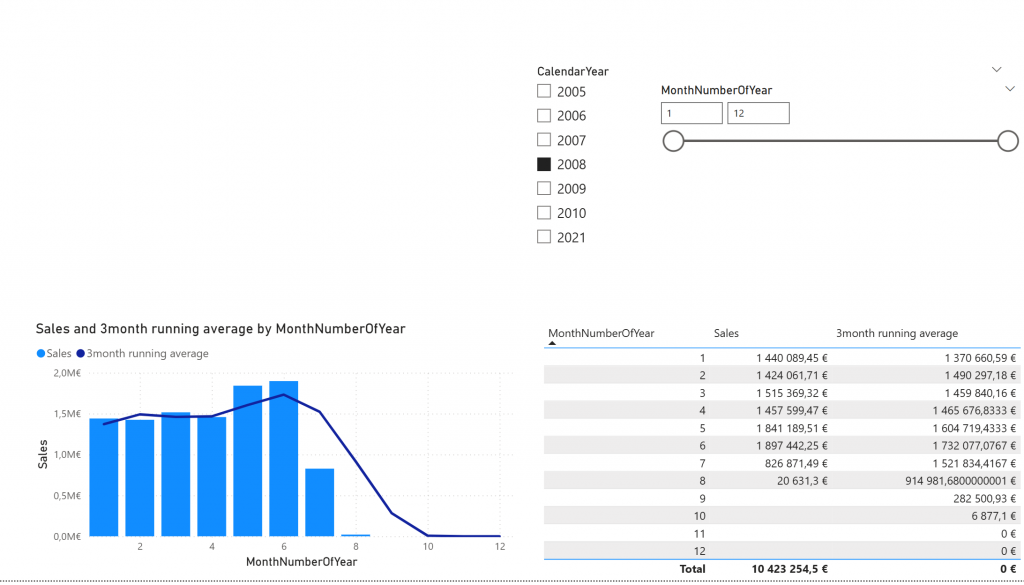
Your task is to create 3month moving average -measure.

Please describe your solution in a answer form.

Model can be found at: https://material.qumio.com/christmas2025/day17.zip

You can return the answer at: https://forms.office.com/e/MgksvgCvh5 You have until end of day 18 to answer. As today is visualization task and there is no file attachment option on the return, just describe the answer.

This Holiday season / Christmas challenge is provided by Vesa Tikkanen and is not linked to Microsoft as company. I just want us to have a puzzle every day going towards the 24th of December. This is pure community effort without any business relations behind. As such I try to do this as professional as possible but please remind that this is just for us to have fun. Microsoft finland has promised some swag as a prize but they are not related to winner pickup process neither they get any details of attendance. Information regarding attendance is not being used in any other thing than picking up the winner. So no marketing, no contacting just Power BI puzzle every day.

Christmas Challenge 2025 – Day  16 – Sales vs total sales of selected time

Power BI is celebrating its 10th anniversary! To mark this milestone, I invite you to participate in the Power BI Christmas and holiday season Calendar. This special event features 24 unique challenges, each designed for you to solve and enjoy throughout the season.

A new challenge will be released every day, starting December 1st and continuing through December 24th. Each day presents a fresh opportunity to test your Power BI skills and creativity.

At the conclusion of the event, a winner will be selected from among the participants. Microsoft Finland has generously offered a prize, with further details to be provided soon.

Throughout December, we will maintain and announce a leaderboard, showcasing participants’ progress. Correct answers will also be shared. You will have two days to solve each puzzle; for example, the puzzle released on day one will close at the end of day two.

Day 16 – Challenge

Today it is about execution context. You have to design measure that calculates Sales comparison between selected month against the whole selected month-slider.

Sales -measure is ready on the model. “Sales CurrentMonth vs Selected Time Period” measure is there but it is not ready. Your task is to modify that measure so that line chart works.

Line chart shows how many percentage month’s sales is against the selected time from the month-slider on the right.

Please describe your solution in a answer form.

Model can be found at: https://material.qumio.com/christmas2025/day16.zip

You can return the answer at: https://forms.office.com/e/pgLcq3fZ53 You have until end of day 18 to answer. As today is visualization task and there is no file attachment option on the return, just describe the answer.

This Holiday season / Christmas challenge is provided by Vesa Tikkanen and is not linked to Microsoft as company. I just want us to have a puzzle every day going towards the 24th of December. This is pure community effort without any business relations behind. As such I try to do this as professional as possible but please remind that this is just for us to have fun. Microsoft finland has promised some swag as a prize but they are not related to winner pickup process neither they get any details of attendance. Information regarding attendance is not being used in any other thing than picking up the winner. So no marketing, no contacting just Power BI puzzle every day.

Christmas Challenge 2025 – Day  15 – Formatting measures

Power BI is celebrating its 10th anniversary! To mark this milestone, I invite you to participate in the Power BI Christmas and holiday season Calendar. This special event features 24 unique challenges, each designed for you to solve and enjoy throughout the season.

A new challenge will be released every day, starting December 1st and continuing through December 24th. Each day presents a fresh opportunity to test your Power BI skills and creativity.

At the conclusion of the event, a winner will be selected from among the participants. Microsoft Finland has generously offered a prize, with further details to be provided soon.

Throughout December, we will maintain and announce a leaderboard, showcasing participants’ progress. Correct answers will also be shared. You will have two days to solve each puzzle; for example, the puzzle released on day one will close at the end of day two.

Day 15 – Challenge

Today you need to satisfy the formatting requirement from your users. You need to do something for the Sales formatted measure. It should output results as shown below.

In detail: If measure is less than 1 million, it should output number as whole number with suffix ” eur” and if it is above million it should be whole number also but only full millions and suffix “milj eur”.

Please describe your solution in a answer form.

Model can be found at: https://material.qumio.com/christmas2025/day15.zip

You can return the answer at: https://forms.office.com/e/F1dmzu0RUi You have until end of day 17 to answer. As today is visualization task and there is no file attachment option on the return, just describe the answer.

This Holiday season / Christmas challenge is provided by Vesa Tikkanen and is not linked to Microsoft as company. I just want us to have a puzzle every day going towards the 24th of December. This is pure community effort without any business relations behind. As such I try to do this as professional as possible but please remind that this is just for us to have fun. Microsoft finland has promised some swag as a prize but they are not related to winner pickup process neither they get any details of attendance. Information regarding attendance is not being used in any other thing than picking up the winner. So no marketing, no contacting just Power BI puzzle every day.

Christmas Challenge 2025 – Day  14 – Sum against Total sum

Power BI is celebrating its 10th anniversary! To mark this milestone, I invite you to participate in the Power BI Christmas and holiday season Calendar. This special event features 24 unique challenges, each designed for you to solve and enjoy throughout the season.

A new challenge will be released every day, starting December 1st and continuing through December 24th. Each day presents a fresh opportunity to test your Power BI skills and creativity.

At the conclusion of the event, a winner will be selected from among the participants. Microsoft Finland has generously offered a prize, with further details to be provided soon.

Throughout December, we will maintain and announce a leaderboard, showcasing participants’ progress. Correct answers will also be shared. You will have two days to solve each puzzle; for example, the puzzle released on day one will close at the end of day two.

Day 14 Challenge

Today is about execution context in DAX. That will be the agenda in many days in the upcoming week. You have 2 measures [Sales] and [TotalSales]. TotalSales should be showing the total sales over all products. You also have 3rd measure [Sales vs Total Sales] which shows portion of the sales when comparing to Total Sales.

As of now Total Sales does not work.

It shows the same number as Sales. You should modify the Total Sales in a way that it shows (in this filter set) the number 29363677,2207 but of course it should really be total sales so if end user changes context to include only 2006 it should show the total from 2006. So do not just write static number :).

Please describe your solution in a answer form.

Model can be found at: https://material.qumio.com/christmas2025/day14.zip

You can return the answer at: https://forms.office.com/e/Zre7D92CWB You have until end of day 15 to answer. As today is visualization task and there is no file attachment option on the return, just describe the answer.

This Holiday season / Christmas challenge is provided by Vesa Tikkanen and is not linked to Microsoft as company. I just want us to have a puzzle every day going towards the 24th of December. This is pure community effort without any business relations behind. As such I try to do this as professional as possible but please remind that this is just for us to have fun. Microsoft finland has promised some swag as a prize but they are not related to winner pickup process neither they get any details of attendance. Information regarding attendance is not being used in any other thing than picking up the winner. So no marketing, no contacting just Power BI puzzle every day.

Christmas Challenge 2025 – Day  13 – Relationships with DAX

Power BI is celebrating its 10th anniversary! To mark this milestone, I invite you to participate in the Power BI Christmas and holiday season Calendar. This special event features 24 unique challenges, each designed for you to solve and enjoy throughout the season.

A new challenge will be released every day, starting December 1st and continuing through December 24th. Each day presents a fresh opportunity to test your Power BI skills and creativity.

At the conclusion of the event, a winner will be selected from among the participants. Microsoft Finland has generously offered a prize, with further details to be provided soon.

Throughout December, we will maintain and announce a leaderboard, showcasing participants’ progress. Correct answers will also be shared. You will have two days to solve each puzzle; for example, the puzzle released on day one will close at the end of day two.

Day 13 – Challenge

Today your challenge is to create a report where sales can be shown by ProductColor. But unfortunately there is no relationship in the model between Fact and DimProduct.

Which means that on the report it looks like every color is having equal amount of sales which is not true:

Your task is to make numbers look correct. But you are not allowed to modify relationships. You can only change measure Sales which by default looks like:

Sales = SUM(FactInternetSales[SalesAmount])

Please describe your solution in a answer form.

Model can be found at: https://material.qumio.com/christmas2025/day13.zip

You can return the answer at: https://forms.office.com/e/eCVvVm2xtw You have until end of day 15 to answer. As today is visualization task and there is no file attachment option on the return, just describe the answer.

This Holiday season / Christmas challenge is provided by Vesa Tikkanen and is not linked to Microsoft as company. I just want us to have a puzzle every day going towards the 24th of December. This is pure community effort without any business relations behind. As such I try to do this as professional as possible but please remind that this is just for us to have fun. Microsoft finland has promised some swag as a prize but they are not related to winner pickup process neither they get any details of attendance. Information regarding attendance is not being used in any other thing than picking up the winner. So no marketing, no contacting just Power BI puzzle every day.

Christmas Challenge 2025 – Day  12 – Custom Calendars

Power BI is celebrating its 10th anniversary! To mark this milestone, I invite you to participate in the Power BI Christmas and holiday season Calendar. This special event features 24 unique challenges, each designed for you to solve and enjoy throughout the season.

A new challenge will be released every day, starting December 1st and continuing through December 24th. Each day presents a fresh opportunity to test your Power BI skills and creativity.

At the conclusion of the event, a winner will be selected from among the participants. Microsoft Finland has generously offered a prize, with further details to be provided soon.

Throughout December, we will maintain and announce a leaderboard, showcasing participants’ progress. Correct answers will also be shared. You will have two days to solve each puzzle; for example, the puzzle released on day one will close at the end of day two.

Day 12 – Challenge

Today is about custom calendars. So dataset has been modified in a way that we only have months from 1 to 6. You should modify the model in a way that we can still use YTD functions.

Describe how you would do that.

So there is the old EnglishMonthName and MonthNumberOfYear but now also new column MonthNumberOfYear6.

Your task is to make the YTD-functions to work on this custom calendar with 6 months only. But YTD functions should work also for the standard calendar!

Please describe your solution in a answer form.

Model can be found at: https://material.qumio.com/christmas2025/day12.zip

You can return the answer at: https://forms.office.com/e/AXtuRi1LjJ You have until end of day 13 to answer. As today is visualization task and there is no file attachment option on the return, just describe the answer.

This Holiday season / Christmas challenge is provided by Vesa Tikkanen and is not linked to Microsoft as company. I just want us to have a puzzle every day going towards the 24th of December. This is pure community effort without any business relations behind. As such I try to do this as professional as possible but please remind that this is just for us to have fun. Microsoft finland has promised some swag as a prize but they are not related to winner pickup process neither they get any details of attendance. Information regarding attendance is not being used in any other thing than picking up the winner. So no marketing, no contacting just Power BI puzzle every day.

Christmas Challenge 2025 – Day  11 – Making months work

Power BI is celebrating its 10th anniversary! To mark this milestone, I invite you to participate in the Power BI Christmas and holiday season Calendar. This special event features 24 unique challenges, each designed for you to solve and enjoy throughout the season.

A new challenge will be released every day, starting December 1st and continuing through December 24th. Each day presents a fresh opportunity to test your Power BI skills and creativity.

At the conclusion of the event, a winner will be selected from among the participants. Microsoft Finland has generously offered a prize, with further details to be provided soon.

Throughout December, we will maintain and announce a leaderboard, showcasing participants’ progress. Correct answers will also be shared. You will have two days to solve each puzzle; for example, the puzzle released on day one will close at the end of day two.

Day 11 Challenge

Today is an easy one. Your task is to make sense to monthly reporting.

Sales should be show in chronological order. As of now when Month name is used it shows the values in alphabetical order.

Please describe your solution in a answer form.

Model can be found at: https://material.qumio.com/christmas2025/day11.zip

You can return the answer at: https://forms.office.com/e/pyGUfVrivC You have until end of day 13 to answer. As today is visualization task and there is no file attachment option on the return, just describe the answer.

This Holiday season / Christmas challenge is provided by Vesa Tikkanen and is not linked to Microsoft as company. I just want us to have a puzzle every day going towards the 24th of December. This is pure community effort without any business relations behind. As such I try to do this as professional as possible but please remind that this is just for us to have fun. Microsoft finland has promised some swag as a prize but they are not related to winner pickup process neither they get any details of attendance. Information regarding attendance is not being used in any other thing than picking up the winner. So no marketing, no contacting just Power BI puzzle every day.

Christmas Challenge 2025 – Day 10 – Visuals that change dimensions on the fly

Power BI is celebrating its 10th anniversary! To mark this milestone, I invite you to participate in the Power BI Christmas and holiday season Calendar. This special event features 24 unique challenges, each designed for you to solve and enjoy throughout the season.

A new challenge will be released every day, starting December 1st and continuing through December 24th. Each day presents a fresh opportunity to test your Power BI skills and creativity.

At the conclusion of the event, a winner will be selected from among the participants. Microsoft Finland has generously offered a prize, with further details to be provided soon.

Throughout December, we will maintain and announce a leaderboard, showcasing participants’ progress. Correct answers will also be shared. You will have two days to solve each puzzle; for example, the puzzle released on day one will close at the end of day two.

Day 10 Challenge

Today we continue on report visualization problems! Business users want to have a single visual that shows sales and taxes either by Product color or by CurrencyName. Having 2 matrix visuals on the screen takes too much space and this has to be completed with single visual.

Answer how you solved this merging. There are probably multiple different solutions but let’s try to achieve this with 1 matrix visual.

Please describe your solution in a answer form.

Model can be found at: https://material.qumio.com/christmas2025/day10.zip

You can return the answer at: https://forms.office.com/e/Jy0a4FGVZs You have until end of day 12 to answer. As today is visualization task and there is no file attachment option on the return, just describe the answer.

This Holiday season / Christmas challenge is provided by Vesa Tikkanen and is not linked to Microsoft as company. I just want us to have a puzzle every day going towards the 24th of December. This is pure community effort without any business relations behind. As such I try to do this as professional as possible but please remind that this is just for us to have fun. Microsoft finland has promised some swag as a prize but they are not related to winner pickup process neither they get any details of attendance. Information regarding attendance is not being used in any other thing than picking up the winner. So no marketing, no contacting just Power BI puzzle every day.

Christmas Challenge 2025 – Day 9 – One Visual, Multiple different measures

Power BI is celebrating its 10th anniversary! To mark this milestone, I invite you to participate in the Power BI Christmas and holiday season Calendar. This special event features 24 unique challenges, each designed for you to solve and enjoy throughout the season.

A new challenge will be released every day, starting December 1st and continuing through December 24th. Each day presents a fresh opportunity to test your Power BI skills and creativity.

At the conclusion of the event, a winner will be selected from among the participants. Microsoft Finland has generously offered a prize, with further details to be provided soon.

Throughout December, we will maintain and announce a leaderboard, showcasing participants’ progress. Correct answers will also be shared. You will have two days to solve each puzzle; for example, the puzzle released on day one will close at the end of day two.

Day 9 – One Visual, Different measures

Today is about making report canvas more interactive. How would you design report and model if business requirement is to have 1 table/matrix visual. That visual can have only 1 number column but should show 2 different values.

I mean that end-user should be able to click somewhere to switch between sum-of-taxes and sum-of-sales. If end user clicks “Tax” it would show only Taxes and if “Sales” it would show only Sales. As a bonus it could show both sales and taxes if I multiselect both but that is not actual requirement.

Here both of the measures are shown. But as said it should be possible to select somewhere what to show. Either Sales or Taxes or as bonus both.

Please describe your solution in a answer form.

Model can be found at: https://material.qumio.com/christmas2025/day9.zip

You can return the answer at: https://forms.office.com/e/yE4ff2EGR9 You have until end of day 11 to answer. As today is visualization task and there is no file attachment option on the return, just describe the answer.

This Holiday season / Christmas challenge is provided by Vesa Tikkanen and is not linked to Microsoft as company. I just want us to have a puzzle every day going towards the 24th of December. This is pure community effort without any business relations behind. As such I try to do this as professional as possible but please remind that this is just for us to have fun. Microsoft finland has promised some swag as a prize but they are not related to winner pickup process neither they get any details of attendance. Information regarding attendance is not being used in any other thing than picking up the winner. So no marketing, no contacting just Power BI puzzle every day.

Christmas Challenge 2025 – Day 8 – Reusable code in DAX Model 

Power BI is celebrating its 10th anniversary! To mark this milestone, I invite you to participate in the Power BI Christmas and holiday season Calendar. This special event features 24 unique challenges, each designed for you to solve and enjoy throughout the season.

A new challenge will be released every day, starting December 1st and continuing through December 24th. Each day presents a fresh opportunity to test your Power BI skills and creativity.

At the conclusion of the event, a winner will be selected from among the participants. Microsoft Finland has generously offered a prize, with further details to be provided soon.

Throughout December, we will maintain and announce a leaderboard, showcasing participants’ progress. Correct answers will also be shared. You will have two days to solve each puzzle; for example, the puzzle released on day one will close at the end of day two.

Day 8 – Reusable code in the model

Today’s challenge builds on top of the Day 7 challenge. We have a lot of Sales Measures in the model. Currently they are all similar and exact same code. In future Business users want that Sales10 = SUM(FactInternetSales[SalesAmount])*10 and Sales11 = SUM(FactInternetSales[SalesAmount])*11. So each Sales measure has a multiplication part where it is being multiplied with the number of the measure. Sales45 multiplies with 45, Sales73 multiplies with 73 etc…

Day after tomorrow they could change their mind again and want that to be Sales10=SUM(FactInternetSales[SalesAmount])*(10/2) and Sales11=SUM(FactInternetSales[SalesAmount])*(11/2).

Abstract that multiplier part so that it can easily be changed whenever needed. So Solution should not be global search and replace where you change hundreds of places the multiplier but a structure which abstracts that so that it is easy to change in one place.

Describe your solution in answer. You have until wednesday 10th to answer! So let’s make it so that we have 3 days time to answer as I can see people answering older questions still today.

Model can be found at: https://material.qumio.com/christmas2025/day8.zip

You can return the answer at: https://forms.office.com/e/RGQCm6v4f6 You have until end of day 8 to answer. As today is visualization task and there is no file attachment option on the return, just describe the answer.

This Holiday season / Christmas challenge is provided by Vesa Tikkanen and is not linked to Microsoft as company. I just want us to have a puzzle every day going towards the 24th of December. This is pure community effort without any business relations behind. As such I try to do this as professional as possible but please remind that this is just for us to have fun. Microsoft finland has promised some swag as a prize but they are not related to winner pickup process neither they get any details of attendance. Information regarding attendance is not being used in any other thing than picking up the winner. So no marketing, no contacting just Power BI puzzle every day.