Answers for Christmas challenge days 17-24

Final batch of answers.

Day  17 – Moving average

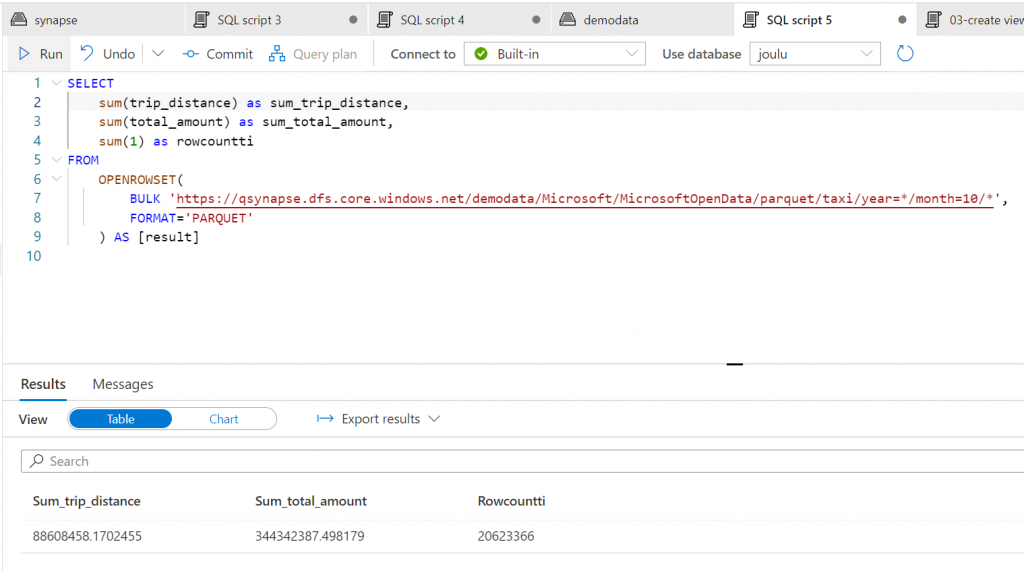
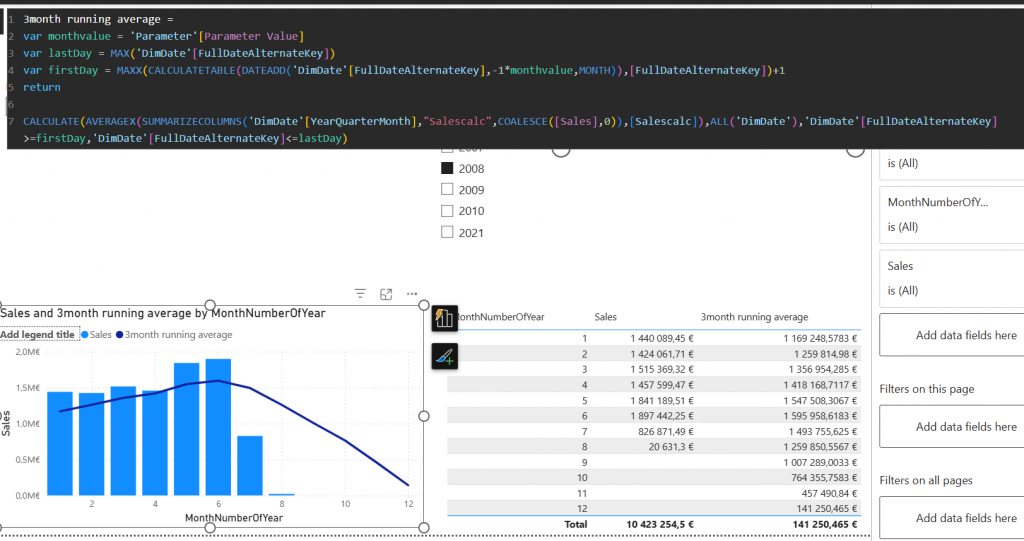
Fixed length moving average problem was about DAX measure. You could write measure like:

3month running average =
var lastDay = MAX(‘DimDate'[FullDateAlternateKey])
var firstDay = MAXX(CALCULATETABLE(DATEADD(‘DimDate'[FullDateAlternateKey],-3,MONTH)),[FullDateAlternateKey])+1
return
CALCULATE(AVERAGEX(SUMMARIZECOLUMNS(‘DimDate'[YearQuarterMonth],”Salescalc”,COALESCE([Sales],0)),[Salescalc]),ALL(‘DimDate’),’DimDate'[FullDateAlternateKey]>=firstDay,’DimDate'[FullDateAlternateKey]<=lastDay)

Idea is to find the last day selected and then calculate backwards 3 months and free the date dimension.

Day  18 – Dynamic moving

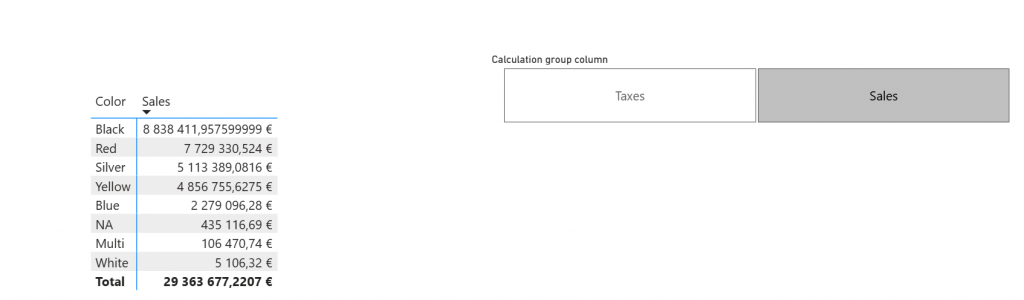
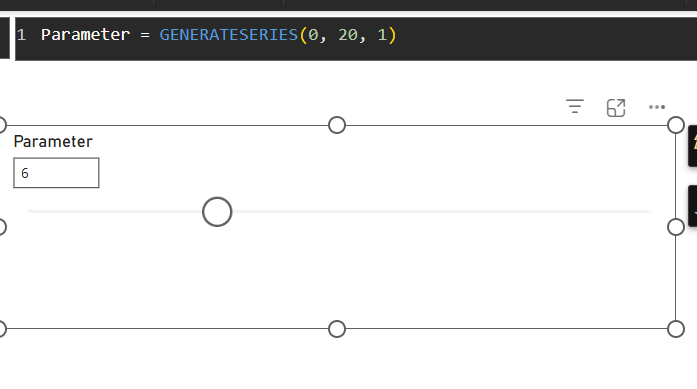
This day was about changing that fixed length 3 month moving average to dynamic. Purpose was to add parameter to report which would allow user to choose how many months the average would be calculated on.

Answer is 2 parts. First the measure:

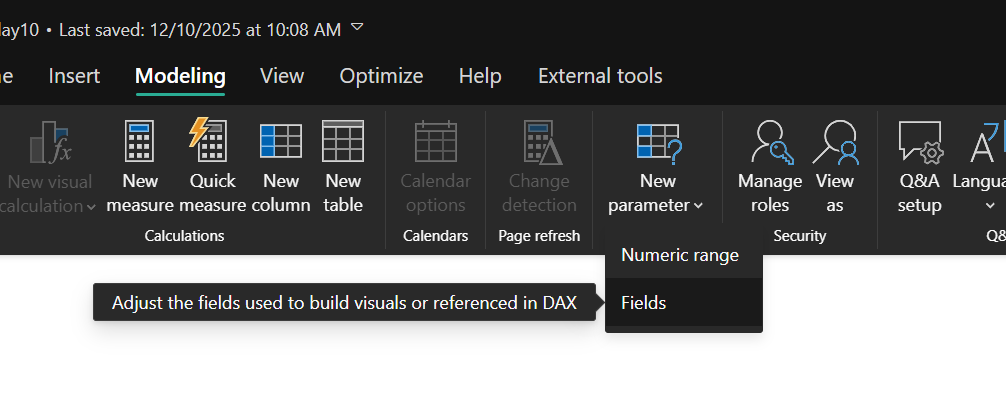
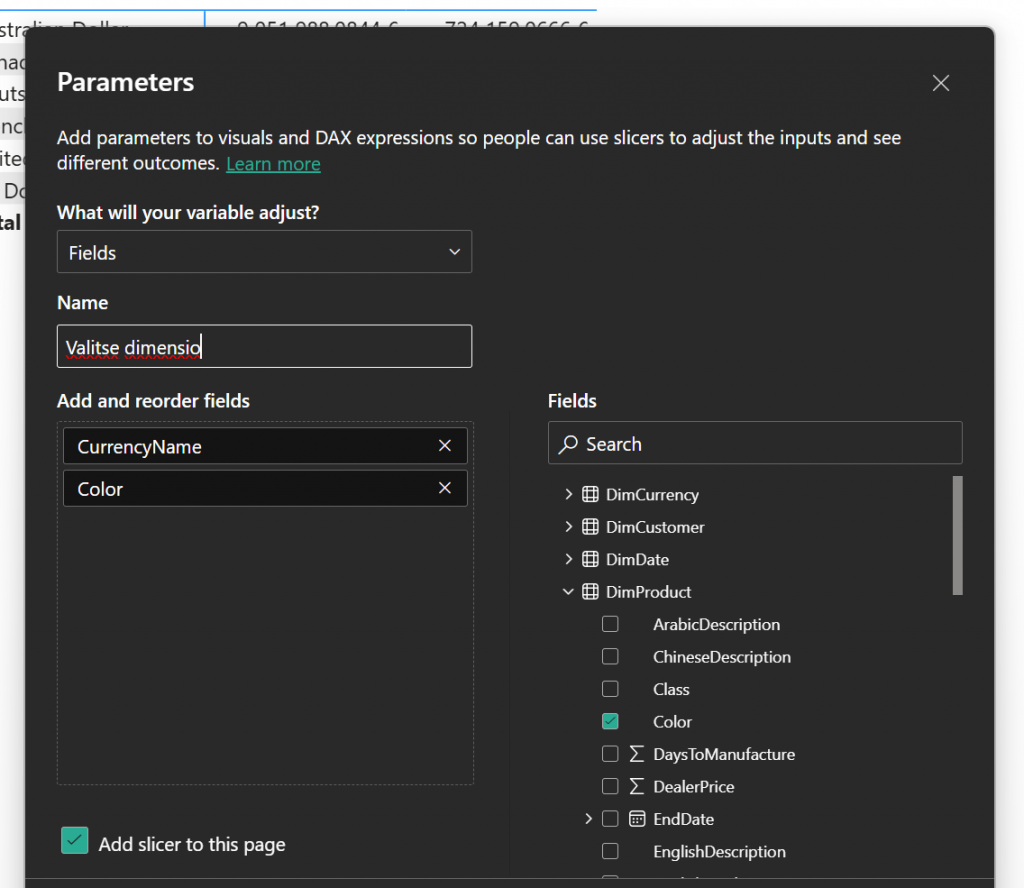
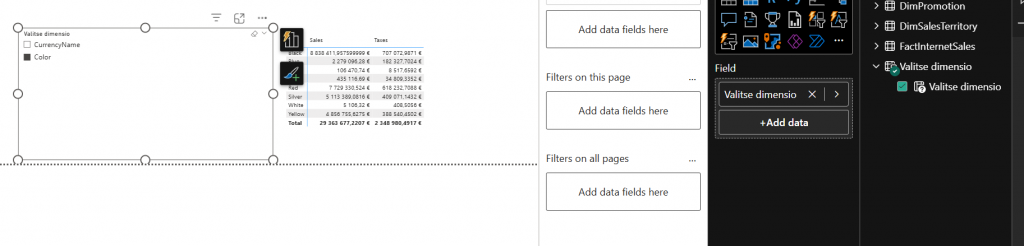
Another part of the solution is the parameter which end user is using to select the month count

Day  19 – weighted average

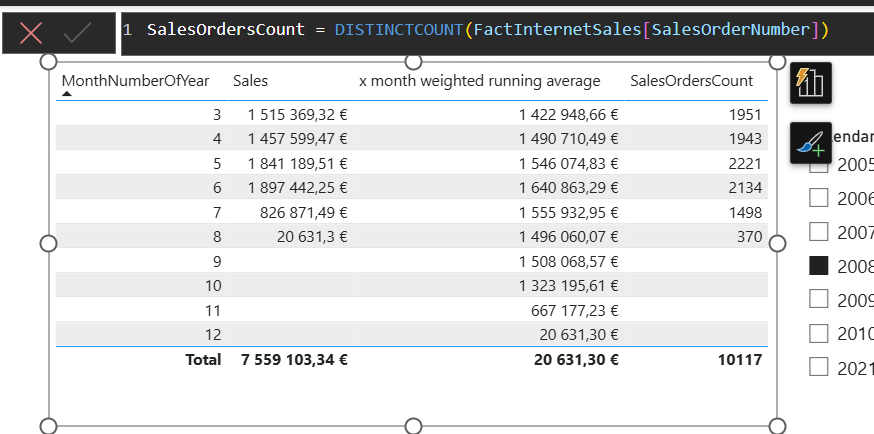
Weighted average is a bit harder problem. It requires the “weight”. In our puzzle weight was about sales order count. So let’s first calculate the weight:

Then this weight is used in actual calculation by multiplying the sales per month with the weight in every month. This is done with sumx

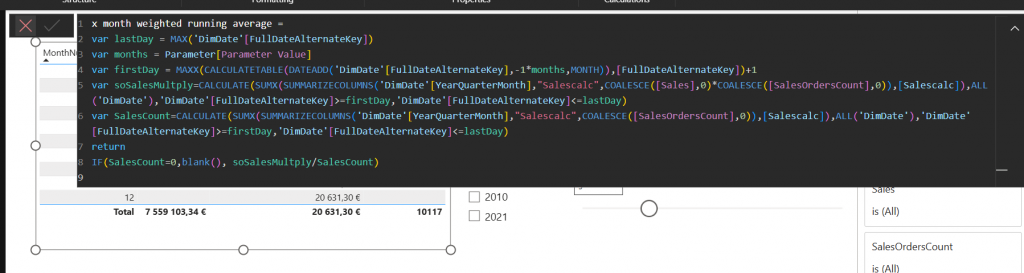
And then divided by the total sales orders count.

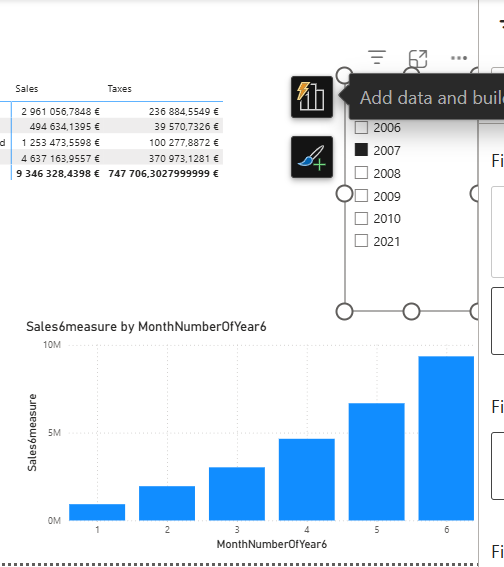
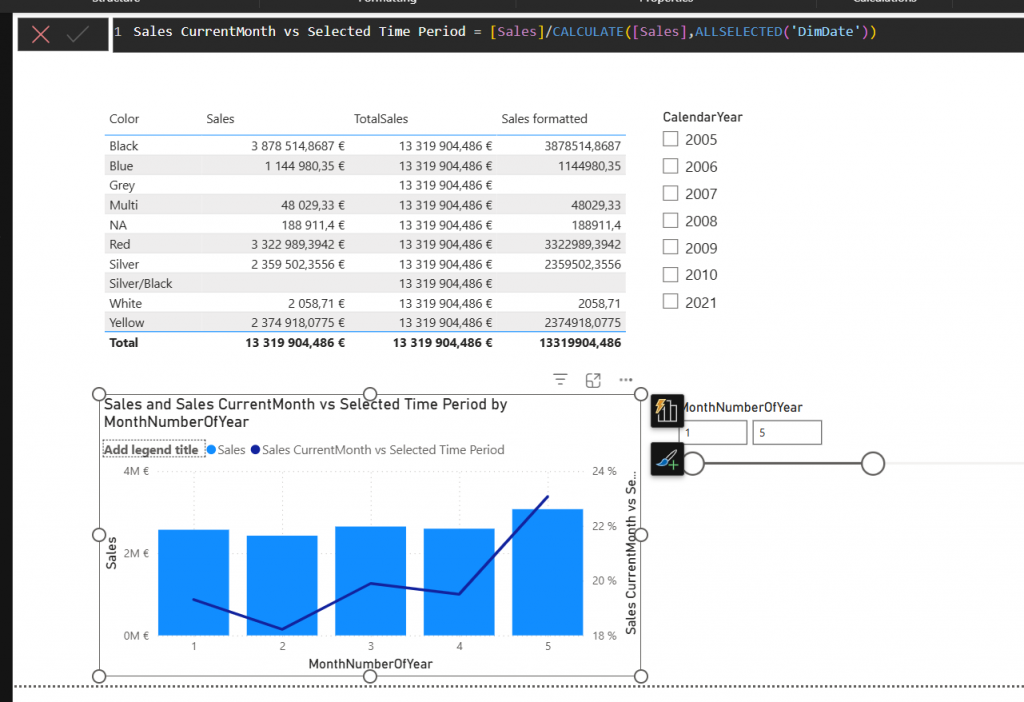
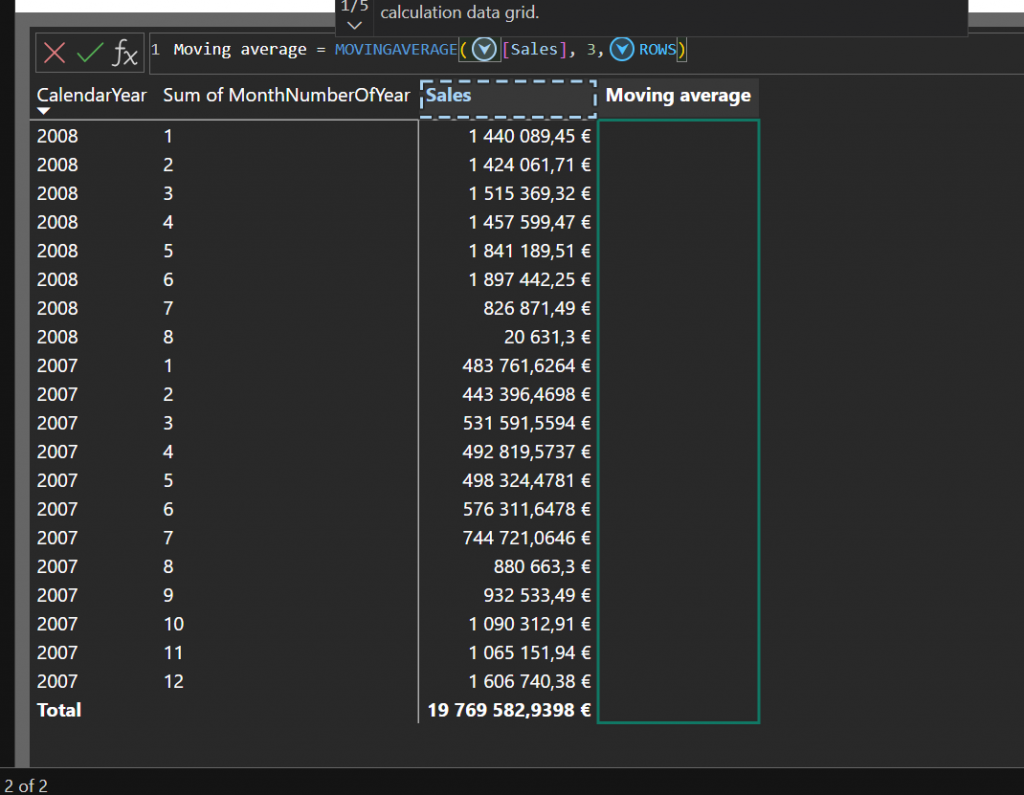
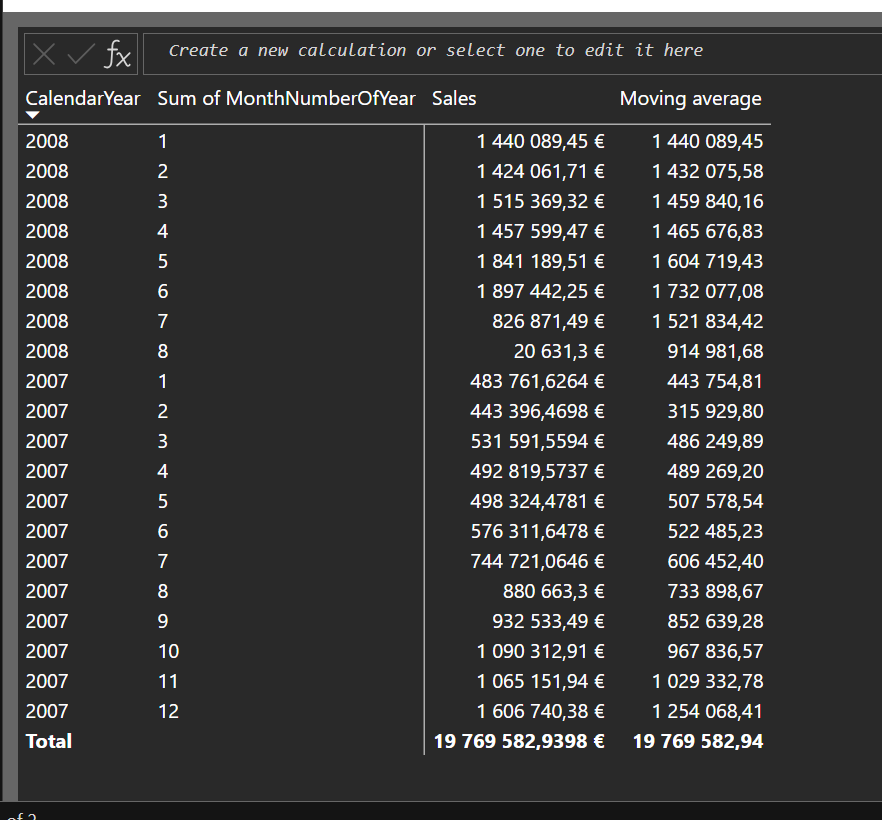
Day  20 – Moving average at visual level

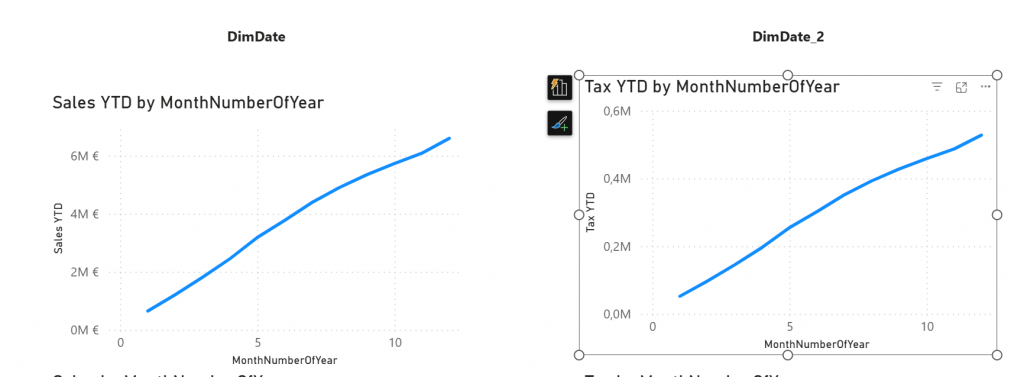
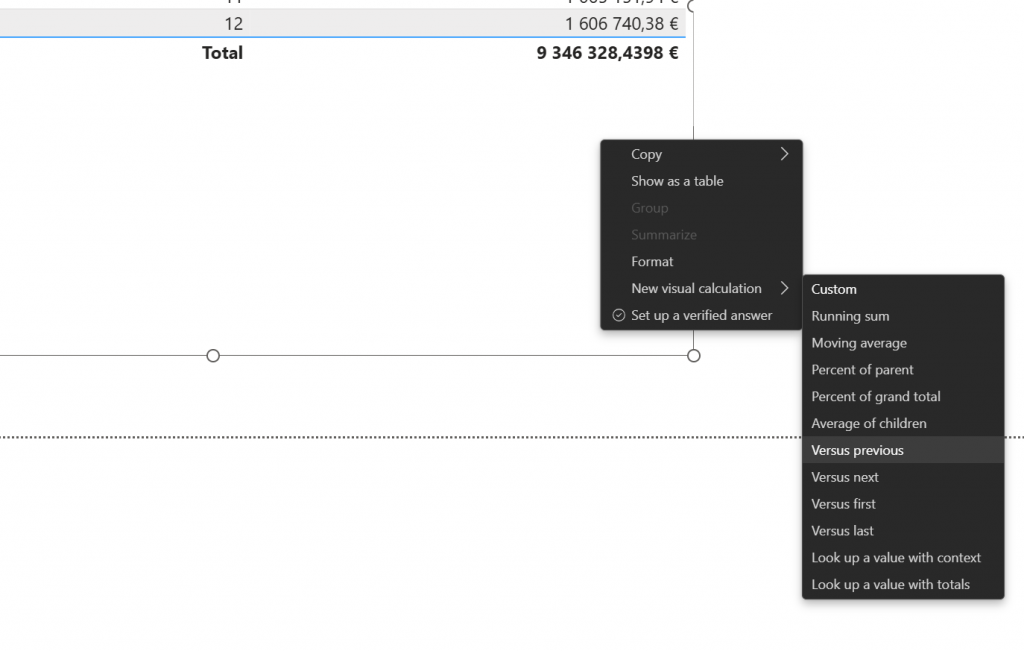
Previous day was about Weighted average in DAX. What about visual calc?

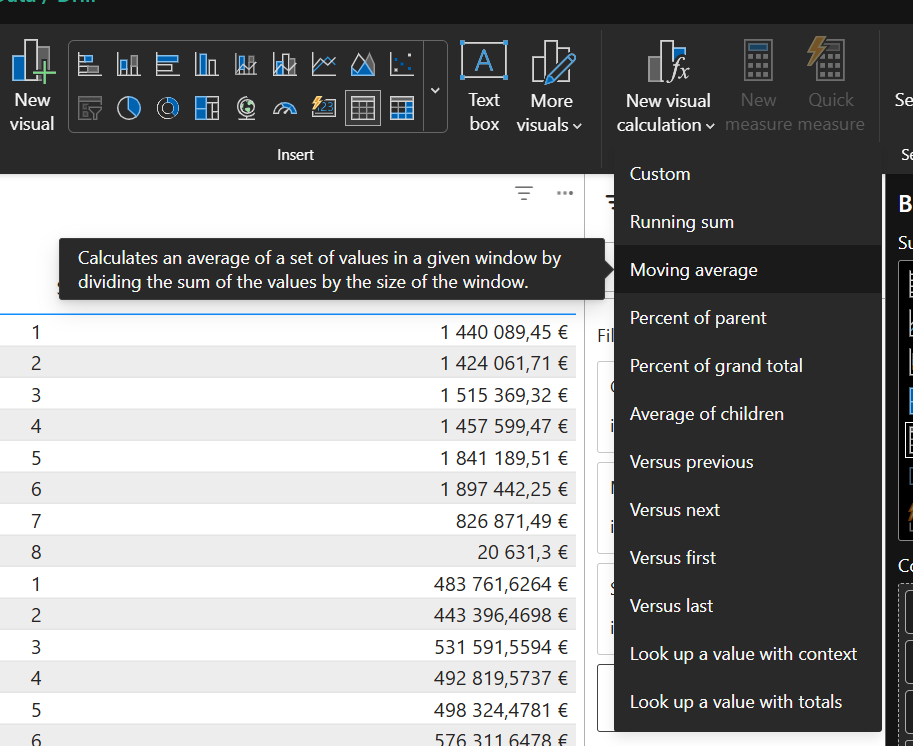
There is prebuilt option to moving average.

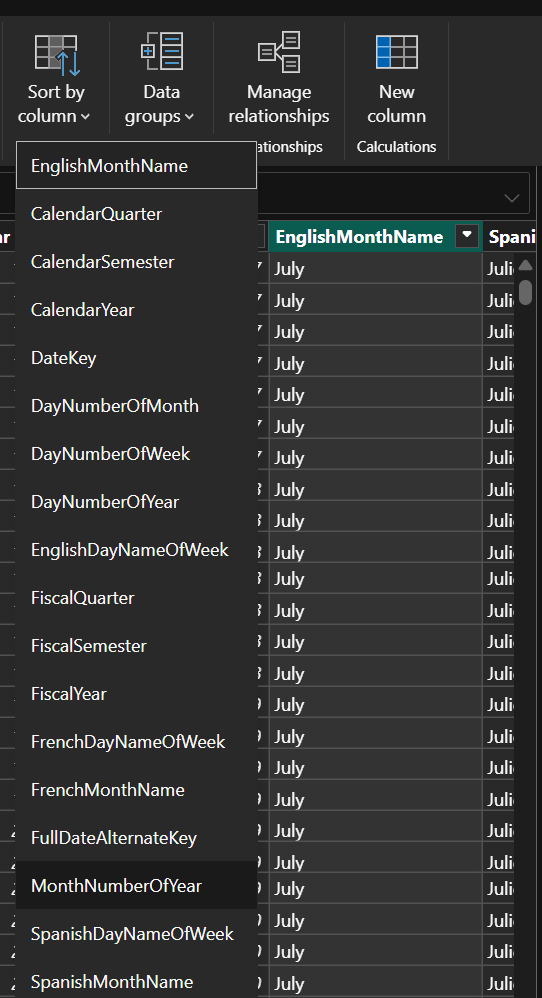
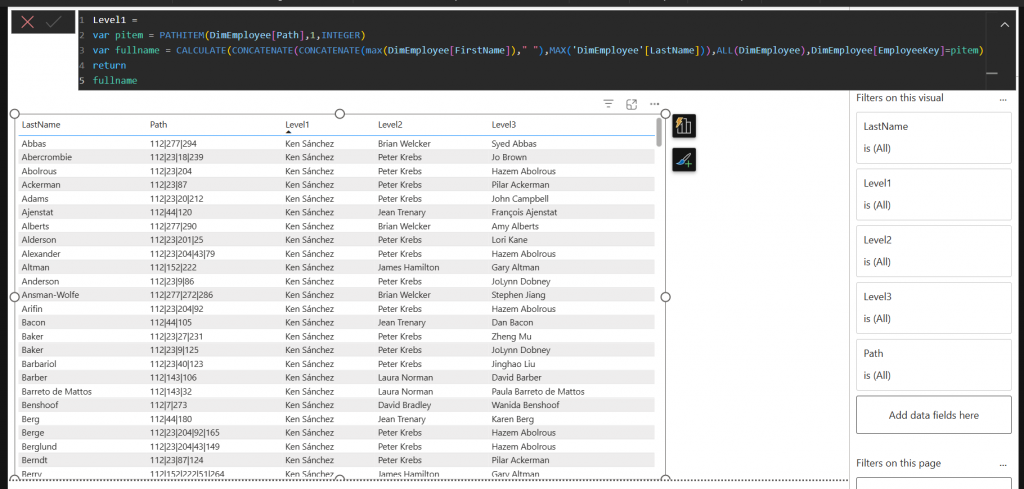
Day  21 – Organisational Hierarchy

Organizational hierarchy is something everyone needs to implement some day. Idea is to calculate column that have hierarchy calculated as path column.

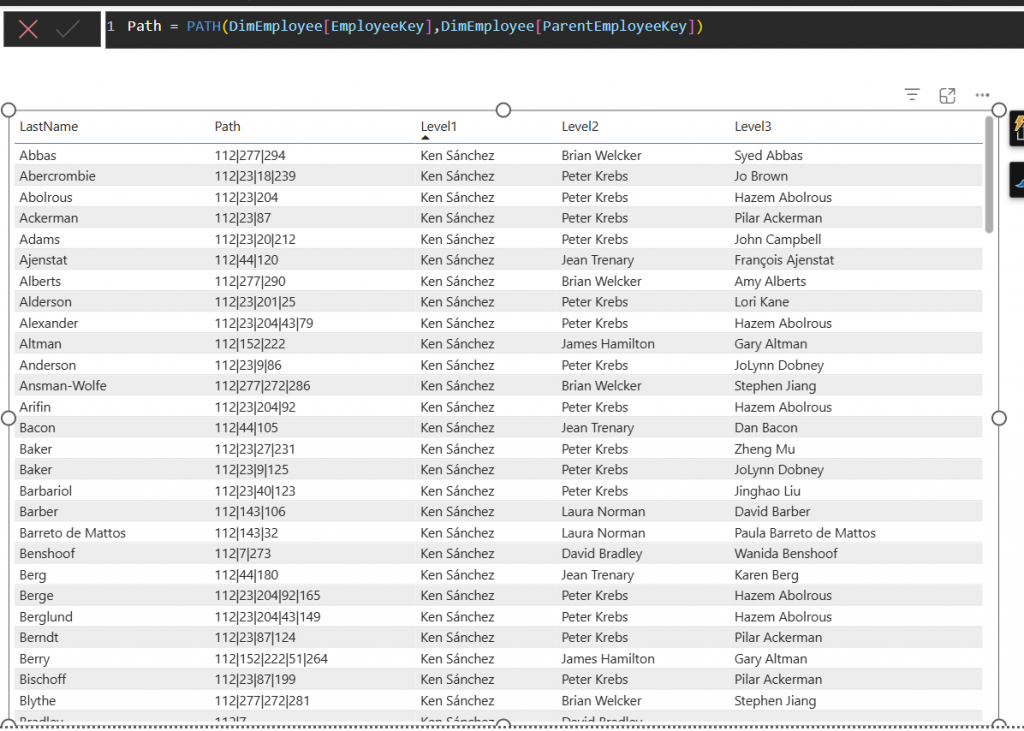
Each level is then showed as calculated columns

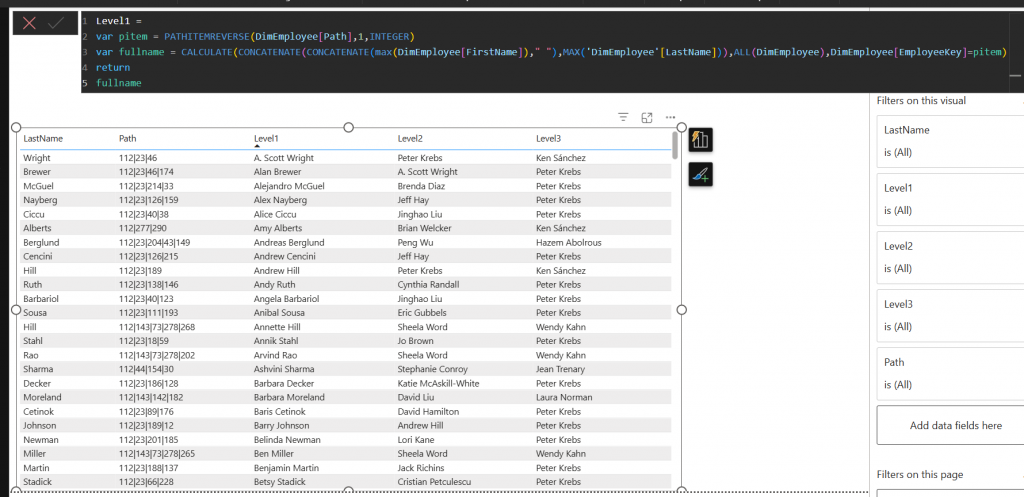
Day  22 – Organisational Hierarchy Reversed

From bottom-to-up hierarchy is pretty similar but using slightly different functions.

There is PATHITEMREVERSE function that we use here.

Day  23 – Statistics Centre Finland Statistics

This was more like follow the instructions. q4.fi is a tool to generate power queries and as there was no single answer this one was to let you familiarize with the tool.

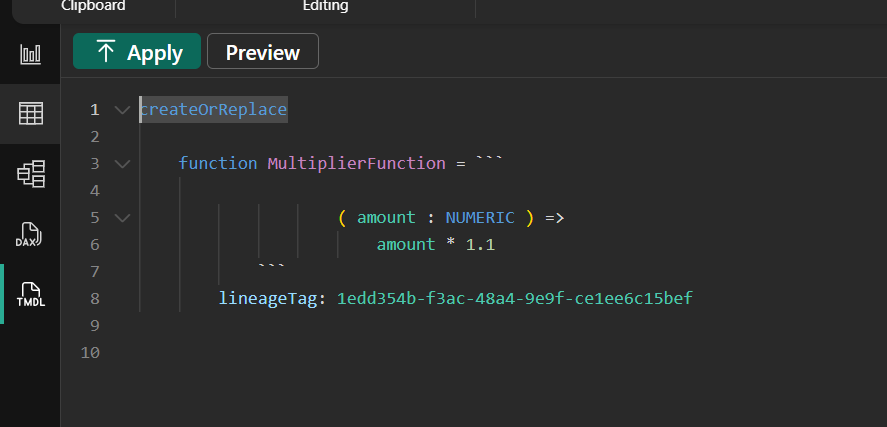
Day  24 – What is the most useful Power BI Feature?

And this was a question to you! For this one I got 17 answers. Each answer was about different topic. People were saying something was good but there were also many complaints.

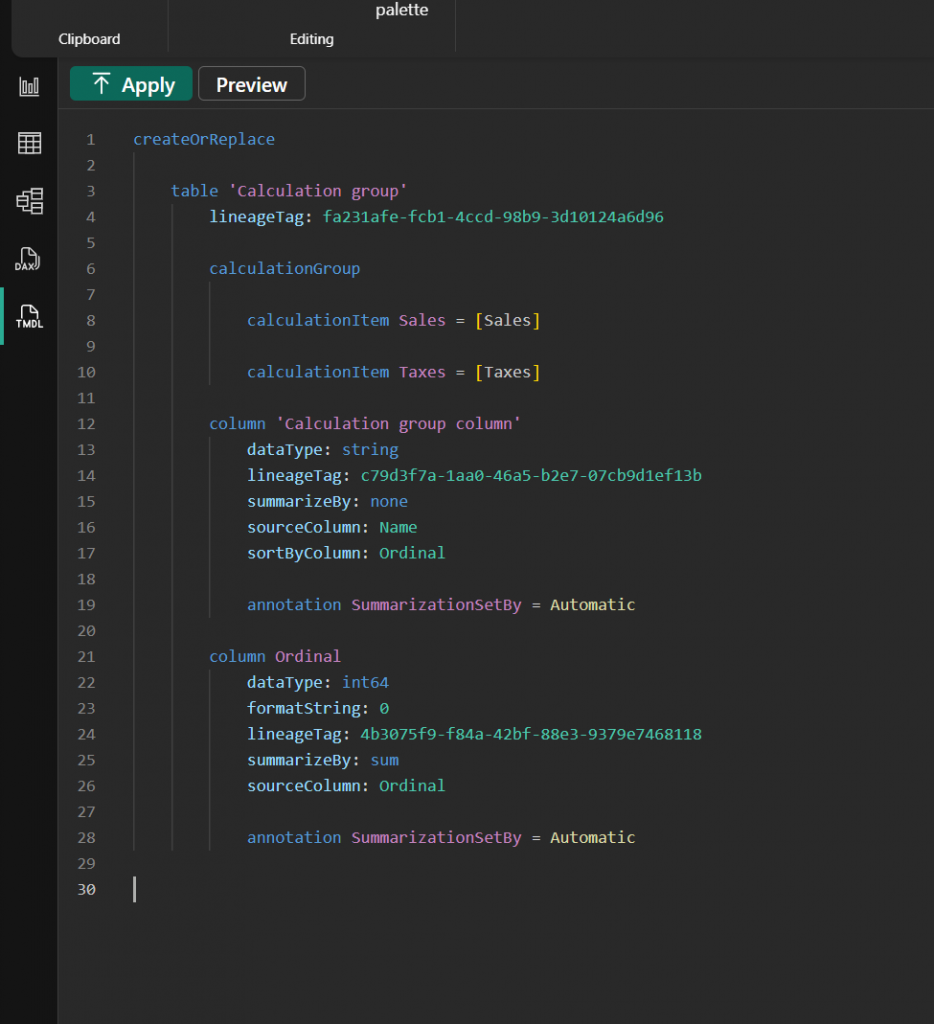
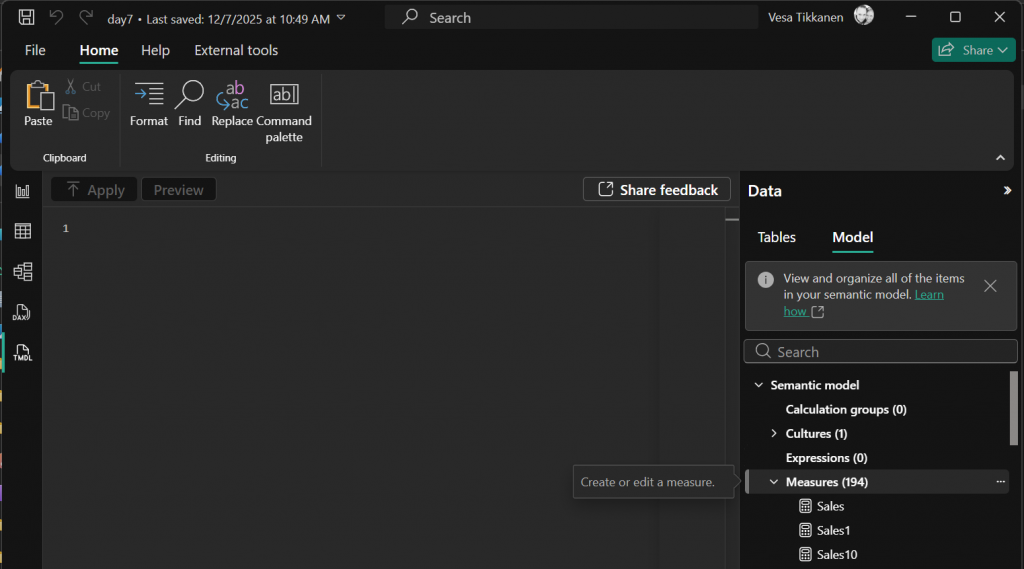
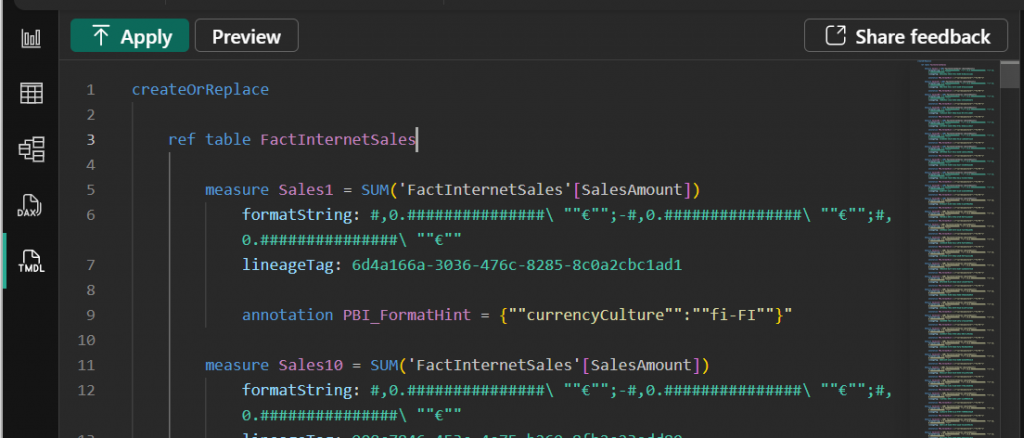
Good things were in more advanced editoring/coding experiences Power BI is getting. This included tmdl editor, dax query view and DAX enhancements.

Critics were against certain specific features like some visuals not working as intended. Some visuals that should be default visuals only available in market place and about general scalable reporting. Power BI is still heavily towards interactive reporting and not so much of fixed reporting (which Microsoft tries to cover with SSRS reports).

Also there was a critics about how my q4.fi works or atleast how you copy data from there… I need to look that as I was not aware of that bug.

Answers for Christmas challenge 2025 days 9-16

Here is answer for Christmas Challenge 2025 days 9-16

Day 9 – One Visual, Multiple different measures

s

When scripting this to TMDL it looks like:

And then you can add a slicer of the calculation group and that changes how the visual behaves.

Day 10 – Visuals that change dimensions on the fly

Day 10 was about field parameters.

Then we can create visual that uses new “valitse dimensio” field and slicer from that field also. And it just works.

Day  11 – Making months work

This was easy. It is order by column.

Day  12 – Custom Calendars

s

Day  13 – Relationships with DAX

Day 13 was about modifying Sales measure. You achieve goal for example like this:

Day  14 – Sum against Total sum

Day 14 was about modifying total sales measure. Here an example:

Day  15 – Formatting measures

Day 15 was about formatting measures. It can be achieved like:

Day  16 – Sales vs total sales of selected time

Day 16 was about sales vs total sales. It was achieved with measure like:

Answers for Christmas challenge 2025 days 1-8

Ok, Here are the answers finally!

I received new answers still after the intended answer time was out so I wanted to see if someone is still doing those and did not start putting answers online. But Now! Let’s go through the first 8 questions today.

Day 1 – Power BI Sales Report

Answer to this is behind relationships. relationship between Currencies and fact is not working. It has to be activated and turned around.

Day 2 – Power BI YTD Sales and Tax report

Day 2 answer is to mark table as date table.

After that visuals look ok

Day 3 – Sales Growth comparing previous month

Day 3 was about creating a measure. Measure took growth percentage from previous month. Here is an example how you could do that.

Day 4 – Sales Growth comparing previous month using visual calc

Answer to challenge was to create visual calc. With visual calc we were comparing to previous value and then formatting that as percentage.

Day 5 – Roles to protect data

Day 5 challenge was about security roles. This was quite easy as this type of role can be created with user interface purely.

Day 6 – Web data and map visuals

This was a independence day celebration. There was no actual correct answer. It was just about “test map visuals”.

Day 7 – batch change within the model

Day 7 challenge was about batch moving objects in semantic model. This can quite easily be done with tmdl view.

Within TMDL view you may script all the measures to window. Delete all measures from the model and recreate them after that.

Day 8 – Reusable code in DAX Model

Challenge was about DAX User Defined Functions. With UDF you can create reusable code that can be called across multiple measures.

Example udf:

Christmas Challenge 2025 – Day 1 – Power BI sales report

Power BI is celebrating its 10th anniversary! To mark this milestone, I invite you to participate in the Power BI Christmas and holiday season Calendar. This special event features 24 unique challenges, each designed for you to solve and enjoy throughout the season.

A new challenge will be released every day, starting December 1st and continuing through December 24th. Each day presents a fresh opportunity to test your Power BI skills and creativity.

At the conclusion of the event, a winner will be selected from among the participants. Microsoft Finland has generously offered a prize, with further details to be provided soon.

Throughout December, we will maintain and announce a leaderboard, showcasing participants’ progress. Correct answers will also be shared. You will have two days to solve each puzzle; for example, the puzzle released on day one will close at the end of day two.

Day 1 Challenge

We start with very easy warm-up! Please read following instructions and submit your answer!

To begin, please download the following Power BI Desktop file: (link: https://material.qumio.com/christmas2025/day1.zip )

The Sales department has created a report intended to display sales by currency name. However, the report is not showing sales correctly.

Your task is to identify the issue with the report and submit your answer at: https://forms.office.com/e/PcFrgdrr3k Remember: No later than end of day december 2nd.

This Holiday season / Christmas challenge is provided by Vesa Tikkanen and is not linked to Microsoft as company. I just want us to have a puzzle every day going towards the 24th of December. This is pure community effort without any business relations behind. As such I try to do this as professional as possible but please remind that this is just for us to have fun. Microsoft finland has promised some swag as a prize but they are not related to winner pickup process neither they get any details of attendance. Information regarding attendance is not being used in any other thing than picking up the winner. So no marketing, no contacting just Power BI puzzle every day.

Use Synapse On-Demand SQL to read Power BI Dataflow CDM data.

This blog post describes how you can read Power BI Dataflow data with Azure Synapse On-Demand SQL.

Power BI service has a special functionality called Power BI Dataflow (https://docs.microsoft.com/en-us/power-bi/transform-model/dataflows/dataflows-introduction-self-service). It allows business users to create data wrangling pipelines, read data from various sources and save it to Azure Datalake Gen2 account.

Dataflow data is useable within Power BI. You can create reports on top of the data contained in dataflows. There are also readers for Python and some other programming languages. Unfortunately there is no reader currently for Azure Synapse Analytics On-Demand SQL.

Azure Synapse Analytics is a new Data Platform umberella from Microsoft (https://azure.microsoft.com/en-us/services/synapse-analytics/). It contains fully compliant T-SQL endpoint for querying data that is located on various sources. Here we are interested about data that sits on Azure Storage.

I have a customer who really needs this functionality as he does not use only Power BI to read but also would like for example use Excel or 3rd party tools to query imported dataflows. If the data would be available from t-sql view then it would be easily accessible.

Pre-requirements – How to map and link Datalake

I got comment from Youtube where it would be necessary to explain how to link Datalake to Power BI and to On-Demand SQL. This is very well explained from Microsoft documentation so I will only link it to here.

Link Datalake to your Power BI Workspace: https://docs.microsoft.com/en-us/power-bi/transform-model/dataflows/dataflows-azure-data-lake-storage-integration

Link your Datalake to Synapse On-Demand. https://docs.microsoft.com/en-us/azure/synapse-analytics/sql/develop-storage-files-overview?tabs=direct-access This is a bit more difficult. You can link with identity passthrough or with SAS tokens. But they are all explained at Microsoft Documentation.

Demo and walk-through

Power BI Dataflow data structure

Power BI Dataflow uses following structure in Datalake Gen2:

Power BI creates container “powerbi” for Storage Account. Under that container there will be a folder for workspace and then folder for dataflow. In this example workspace is “Synapse Integrated” and dataflow is “qsql”.

model.json file contains information about all the entities. Actual entities and their data is stored in folders.

You can see that as the Dataflow has entity DimCustomer then Datalake Gen2 has a folder for DimCustomer.

Model.json describes the content. It has description for each entity, its fields and actual datafiles that should be included for the entity.

Datafiles and versioning

When you refresh your dataflow, Power BI will save new version of the entity data. It can be found from Datalake.

Model.json file describes which of these files are used to read the data.

How to read data?

Ok, enough for CDM data description. How can I read that data? We need to iterated through model.json files as they contain the required information.

I created a view [powerbi].[PowerBIModels] that does exactly that.

You can query that view to find what dataflows you have. What columns there are and what are the filenames behind.

This is not enough, we need to create the actual view from this information that would read the CDM data. This is done with the Stored Procedure [powerbi].[createModelView]

It takes 3 parameters.

  • Workspace name
  • Dataflow name
  • Entity name

After you run the procedure it creates a view for you. Name of the view is in format: [powerbi].[workspace name_dataflowname_entity-name]

Example: [powerbi].[Synapse Integrated_qsql_DimCustomer]

Data is easy to query. Data remains same until we refresh the view.

View is refreshed by re-running the procedure.

Code..

Ok, sounds interesting? Where do I find the code? I created a public Github repo and uploaded these scripts there. Feel free to download them from: https://github.com/vesatikkanen/Synapse-PowerBI-DataFlow-Reader

And yes, if you want to enchange the script someway you can do so and if you are willing to share your enhancements I would be very happy!

Joulupähkinän tulokset

Tein joulukuussa blogisarjan, jossa jokaisena joulukuun 24 ensimmäisenä päivänä näille sivuille tuli jokin Microsoft Data-aiheinen pulma. Aikaa ratkaista pulma oli kyseinen päivä ja sit seuraavana päivänä tuli vastaus + uusi pulma. Eräänlainen joulupulmakalenteri siis.

Ensimmäisenä päivänä pulmaan tuli eniten vastauksia, yhteensä 21 kpl (2. päivän blogissa lukee 19 mutta varmaan silmät haritti tai jotain). Sen jälkeen määrä vaihteli ollen pienimmillään 5 ja suurimmillaan 18.

Aiheina Power BI/tabulaarisen mallinnuksen ongelmat olivat suosituimpia. T-SQL kielen sisäisen tietämyksen ongelmat sellaisia, joihin tuli vähiten vastauksia. Esimerkiksi 12. ongelma suoritussuunnitelmista sai vain 5 vastausta lopulta. Ehkä pilviaika näkyy siinä mielessä että moni meistä soveltaa ja käyttää palveluita, eikä enää tutki niiden sielunelämää. Tämä on hyvä suuntaus, koska sillä tavalla tuotetaan enemmän lisäarvoa. Epäilen kuitenkin että myös pinnanalla tapahtuvalle selvittelylle on sijaa vielä kauas tulevaisuuteeen. Ongelmat ehkä vaihtuvat, mutta eivät ne palvelut toimi ikinä kaikissa tapauksissa täydellisesti.

Vastauksia tuli siis aika hienosti. Yhteensä 46 eri nimimerkkiä palautti vastauksen. Kuitenkin vain 16 henkilöä palautti useamman kuin yhden vastauksen.

Vastausten kärki meni seuraavasti (nimet julkaistu henkilöiden luvalla)

  • Joni Juutilainen, 24 vastausta
  • Santeri Virtanen, 23 vastausta
  • xx, 18 vastausta
  • xx2, 16 vastausta
  • xx3, 15 vastausta

Jussi Roine Microsoftilta (https://twitter.com/jussiroine) lupasi ennen joulua pari palkintoakin kisaan. Jonille ja Santerille on siis lähdössä postilla Azure-henkinen tuotepalkinto! Jussi kerkesi tuon jälkeen jo vaihtaa uusiin haasteisiin ja hänet löytää nykyisin http://www.northadvisors.com – startupin puikoista, mutta palkinnot ovat silti tulossa. 🙂

Muutama kysely on tullut, toistuuko tämä ensi vuonna? En lupaa vielä, koska loppua kohden alkoi tuntumaan ehkä vähän isolta kakulta mutta jospa aika kuultaa muistot ja tämä toistuu! Toisaalta olen miettinyt sellaista viikottaista pähkinää, jolloin olisi 52 pähkinää vuodessa mutta ei tarttis joka ilta miettiä mikä on sopiva pähkinä huomiselle.

Iso kiitos myös Oskari Heikkiselle (https://twitter.com/oskarialex)! Oskari teki yhden pulman ja auttoi mielipiteellään monessa.

Lopuksi kiitos Lauralle! (https://www.linkedin.com/in/lauratikkanen/) Ei olisi onnistunut ilman vaimoa! Iskä miettii joka ilta seuraavan päivän pähkinää ja lapset saatiin silti nukkumaan ja kaikki perheen jutut tehtyä. Meillä on jo reilu 15-vuotta yhteistä matkaa takana (5585 päivää tarkalleen tätä kirjoittaessa) ja rouva on jaksanut näitä mun tempauksia koko ajan!

Joulupähkinä #24 – Paljonko on aikaa jouluun 2021?

Viimeinen joulupähkinä on täällä! Mietin että minkälainen on viineine joulupähkinä? Joku tosi vaikea, työläs vai mikä? Lopulta olen aika varma että käytännössä kaikki haluavat vain hiljentyä Joulun viettoon ja pähkinä on varmasti aika lailla listan pohjalla. Siksi niille muutamille, jotka tiedän että aikovat palauttaa myös viimeisen joulupähkinän ajattelin että sen on oltava jotenkin helppo, mukautuva ja eteenpäin katsova.

Pähkinä on siis: Tee kysely, koodi, skripti tai ohjelmanpätkä joka laskee aikaa jouluaaton alkuun 2021! Saat tehdä sen ihan just sillä helpoimmalla ja nopeimmalla kielellä. Jos siis luulet että onnistuu helpoiten DAX-suureella, tee se sillä, jos T-SQL selectillä, tee sillä! Jos Python tai c# on parasta, sillä tai ehkä PowerShellillä? Tai ihan millä tahansa muulla ohjelmointikielellä ja tuloksen muotoilunkin saat miettiä just itselle sopivaksi. Kysymys siis: Tee yksinkertainen toteutus joka suoritettaessa palauttaa ajan jouluun 2021 sopivassa muodossa.

Erittäin huippua, kun oikeasti tosi moni kävi joka päivä katsomassa pähkinää. Pähkinän sivulla oli aina n. 40-100 kävijää per päivä. Palautuksia tuli alkuun enemmän, isoimpana päivänä muistaakseni 25 kpl. Kun joulukuu eteni, palautusmäärät vähenivät ja pienimpinä päivinä oli 4 palautusta. Nämä ko. päivänä palauttaneet taisivat palauttaa melkein jokaisena päivänä, ainakin nimimerkit olivat kovin tuttuja.

Toivottavasti sinulla on huippu Joulu! Rauhoitu nyt, kun on 4 päivää enemmän ja vähemmän pyhiä putkeen. Jos olet työtehtävissä Joulun aikaan, toivottavasti pääset välipäivinä tai heti vuoden alussa vetämään happea!

Kiitos kaikille ja nähdään Microsoft Data juttujen parissa seuraavaksi ainakin kahvihetkien kautta! Pähkinän palkintoihin palaan joulun pyhinä tai välipäivinä. Lasken palautukset ja olen Jussi Roineeseen Microsoftille yhteydessä koska Jussi lupasi Microsoftin sponsoroivan community-paketit voittajille!

Jouluaaton palautuksen voit tehdä tuttuun tyyliin Microsoft Forms lomakkeella.

Ja jos missasit maanantain kahvihetken, kannattaa tsekata oheinen video! Aisla esittää matkustusraporttia ja Power BI:n uusinta ominaisuutta.

Pähkinän #23 vastaus

Kiitos Oskarille pähkinästä. Vastaus voi olla riippuvainen käytössäsi olevasta Azure tenantista, joten vastaukseksi hyväksytään kaikki perusteluineen annetut.

Vastaus löytyi ainakin https://portal.azure.com/#blade/Microsoft_Azure_Support/HelpAndSupportBlade/newsupportrequest -sivulta aloittamalla tekemään uutta tukitikettiä. Kun valitsee seuraavasti:

Voi tämän jälkeen painaa Enter details nappia:

Ja kun on painanut, avautuu valikko josta nykyisen defaultin näkee:

Ja tuossa lukee 2 petatavua tällä hetkellä storage accountin kokorajoituksena.

Joulupähkinä #23 – Azure Storagen kapasiteetti

Toiseksi viimeisen pähkinän takana on Oskari Heikkinen (Twitter: @oskarialex). Kyse on Azure Storagesta ja siitä, paljonko sinne saa tavaraa sisään? Azure Storage accountin maksimikapasiteetti on 5PB (listattu täällä: https://docs.microsoft.com/en-us/azure/azure-resource-manager/management/azure-subscription-service-limits#storage-limits). Oletusarvoisesti maksimikapasiteetti on kuitenkin vähemmän. Kuinka paljon dataa voit tallentaa Azure Storage accounttiisi West Europe regionassa oletusarvoisesti avaamatta tukitikettiä Microsoftin suuntaan?

Vastaus voi periaatteessa olla moniselitteinen ja toisaalta voi vaatia Azure AD loginin, joten nyt on tärkeää perustella vastaus.

Oskarilta voit kysyä lisätietoja Twitterissä: @oskarialex) / Twitter tai Linkedinissä: Oskari Heikkinen | LinkedIn

Enää yksi päivä aattoon! vielä jaksaa jaksaa pari pulmaa!

Microsoft Forms lomakkeella pystyt vastaamaan kyselyyn.

Pähkinän #22 vastaus

Vastaus pähkinään 21 ja 22 menee siis suurin piirtein samalla lailla. 22:ssa on vain * polussa! Vastauksia tuli 21 kysymykseen 8kpl ja 22 kysymykseen 6 kpl. Kiitos kaikille!

Joulupähkinä #22 – synapse on-demand SQL ja kansiorakenne

Tämän päivän pähkinä jatkaa siitä mihin eilinen jäi, eikä pitäisi olla kauhean monimutkainen! Sama kysymys, kuin eilen mutta ota kaikki lokakuut jokaiselta vuodelta! Tee laskenta yhdellä kyselyllä.

Aineisto on osoitteessa: https://qsynapse.dfs.core.windows.net/demodata/Microsoft/MicrosoftOpenData/parquet/taxi/year=2017/month=10/

Kansiossa on parquet formatoituja tiedostoja ja huomaa että tuossa esimerkkiosoitteessa on nyt vuosi 2017. Sun pitää kysellä kuitenkin yli kaikkien vuosien!

Käytössäsi on palvelin seuraavilla tiedoilla:

Palvelin: qdw-ondemand.sql.azuresynapse.net
käyttäjätunnus: joulu
salasana: kalenteri123!
tietokanta: joulu

Päivän #21 pähkinän tulos tulee vasta myöhemmin, koska tämä nojaa niin vahvasti siinä tehtyihin löydöksiin 🙂

Voit palauttaa tehtävän Microsoft Forms lomakkeella.

Joulupähkinä #21 – Synapse On-Demand SQL kyselyt

Tänään Synapsea! Tehtävänäsi on katsoa, montako matkaa, paljonko niistä on yhteensä veloitettu, sekä miten pitkä matka on kuljettu yhteensä aineistosta, jotka löytyvät datalakesta.

Aineisto on osoitteessa: https://qsynapse.dfs.core.windows.net/demodata/Microsoft/MicrosoftOpenData/parquet/taxi/year=2017/month=10/

Kansiossa on parquet formatoituja tiedostoja.

Käytössäsi on palvelin seuraavilla tiedoilla:

Palvelin: qdw-ondemand.sql.azuresynapse.net
käyttäjätunnus: joulu
salasana: kalenteri123!
tietokanta: joulu

Tuohon tietokantaan on liitetty credential automaattisesti, jota joulu-käyttäjällä on lupa käyttää. Luo siis kysely, joka kysyy tuosta kansiosta kaikkia tiedostoja. Sen jälkeen summaa sieltä löytyvät trip_distance ja total_amount ja lisäksi laske rivien lukumäärä. Palauta nämä tiedot vastauksessasi.

Vastauksen voit palauttaa Microsoft Forms -lomakkeella.

Pähkinän #20 vastaus

Pähkinä #20 oli vähän kompa. Se kuningasajatus on, että tuollainen exists-lause palauttaa aina true, jos kyseessä on aggregaatti… eli tämä palauttaa kaikki 8-riviä:

Ja jos otan tuon MIN() tuosta pois, palautuu vain 6-riviä:

Mutta mitään ei käytännössä tartte laskea, koska MIN-funktio palauttaa aina true.